Home > Off the Charts > Glass Ceilings, Broken Rungs, and Gummy Floors
Glass Ceilings, Broken Rungs, and Gummy Floors, Part 1: Race
High growth sectors and high median wage jobs are still out of reach for college educated Black people in America.
Summary
Despite significant strides in college attainment, Black people in America face multiple obstacles in their pursuit of rewarding, lucrative careers. Even among Black professionals holding some of the most marketable degrees (STEM), highest-paying and highest-growth jobs in the technology sector remain elusive.
Introduction
In observance of Black History month, we survey the progress made in equal employment opportunity in the United States. Nearly 60 years ago, at The March on Washington—the largest demonstration in the history of DC, Martin Luther King Jr. delivered the oft-quoted “I have a dream” speech. The full name of the event unfortunately was truncated in subsequent retelling, leaving out an all too important aspect of the very purpose of this demonstration. As Gene Denby, of NPR’s Code Switch, explains:
Although the "I have a dream" and the "content of their character" bits tend to get top billing in these remembrances, the event was called "The March on Washington for Jobs and Freedom" — and it's worth noting that the word "jobs" comes before "freedom." Martin Luther King Jr., the NAACP, and the march's organizers were calling for some very specific economic policies they thought would improve the material well-being of black folks in America.
Six decades later, the gap in employment inequality remains stubborn and sizeable—particularly among high-paying and high-growth jobs. For this analysis, we focus on the experience of STEM graduates across sectors. We find that, even accounting for disparities in education, Black STEM grads are underrepresented in high-growth sectors, like technology, and in higher-paying roles. In technology companies, Black people are largely clustered at the lowest-paying positions, with little representation in the middle, senior, and executive levels. Several sustained interventions are needed at a firm level to resolve this festering issue of glass ceilings, broken rungs, and gummy floors. A granular focus on diversity—in hiring, growth, and retention—at all levels of the organization, greater transparency in publishing EEO-1 reports publicly, and periodic benchmarking of diversity efforts and outcomes against one’s own industry peers and across industries are some ways to effect this change.
According to the latest census, the United States is composed of approximately 13.4% Black people, 18.5% Hispanic, 60.1% white, 5.9% Asian, and 2.1% others. Nearly two-thirds of each of these major groups participate in the labor force. Among them, Black people were more likely to be unemployed: in the 4th quarter of 2021, 6.7% of Black folks were unemployed, 3.4% white folks were unemployed, and the national average was at 3.9% unemployment. Black unemployment is consistently close to twice the white unemployment rate, and the Black-white unemployment gap holds across all levels of educational attainment and age cohorts.
Black Americans have made dramatic gains in educational attainment, but significant employment disparities remain
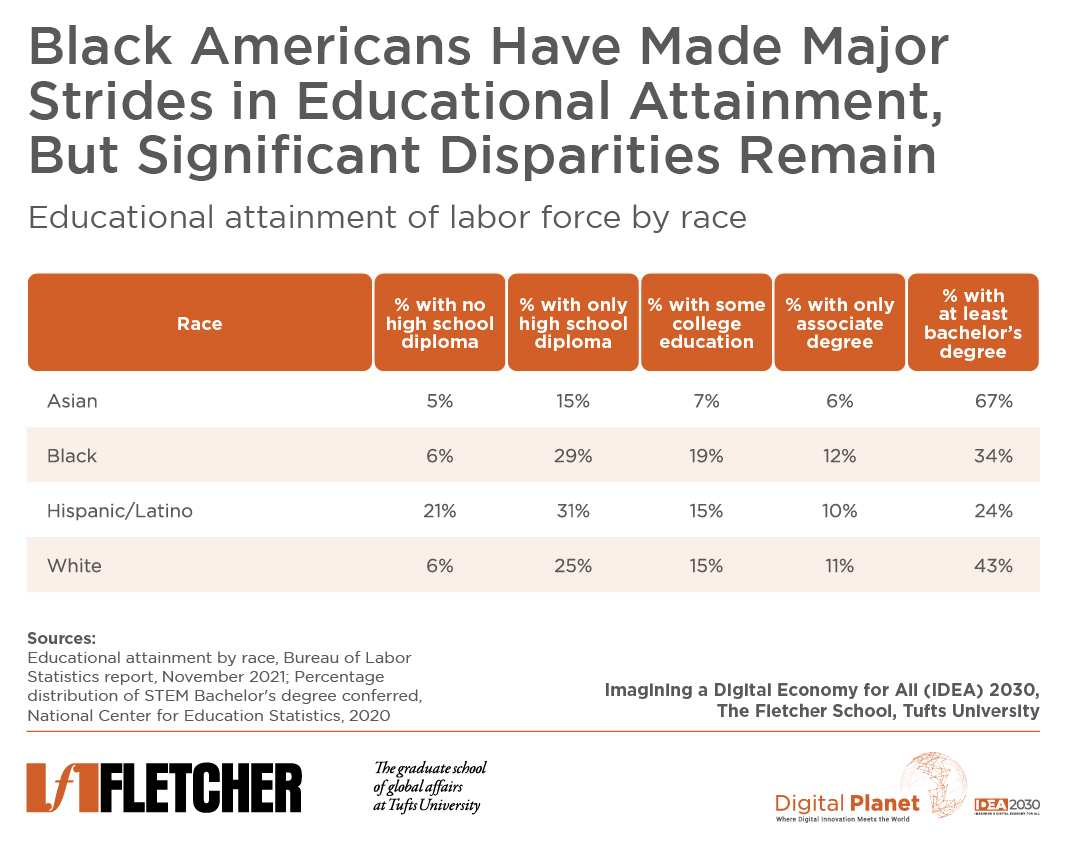
Since the March on Washington for Jobs and Freedom, Black Americans have made major strides in educational attainment with 34% of Black people attaining a bachelor’s degree or higher, compared with just 3.1% in 1965. As of 2020, 94% of Black Americans hold at least a high school diploma, in comparison to 27.2% just two years after the march.
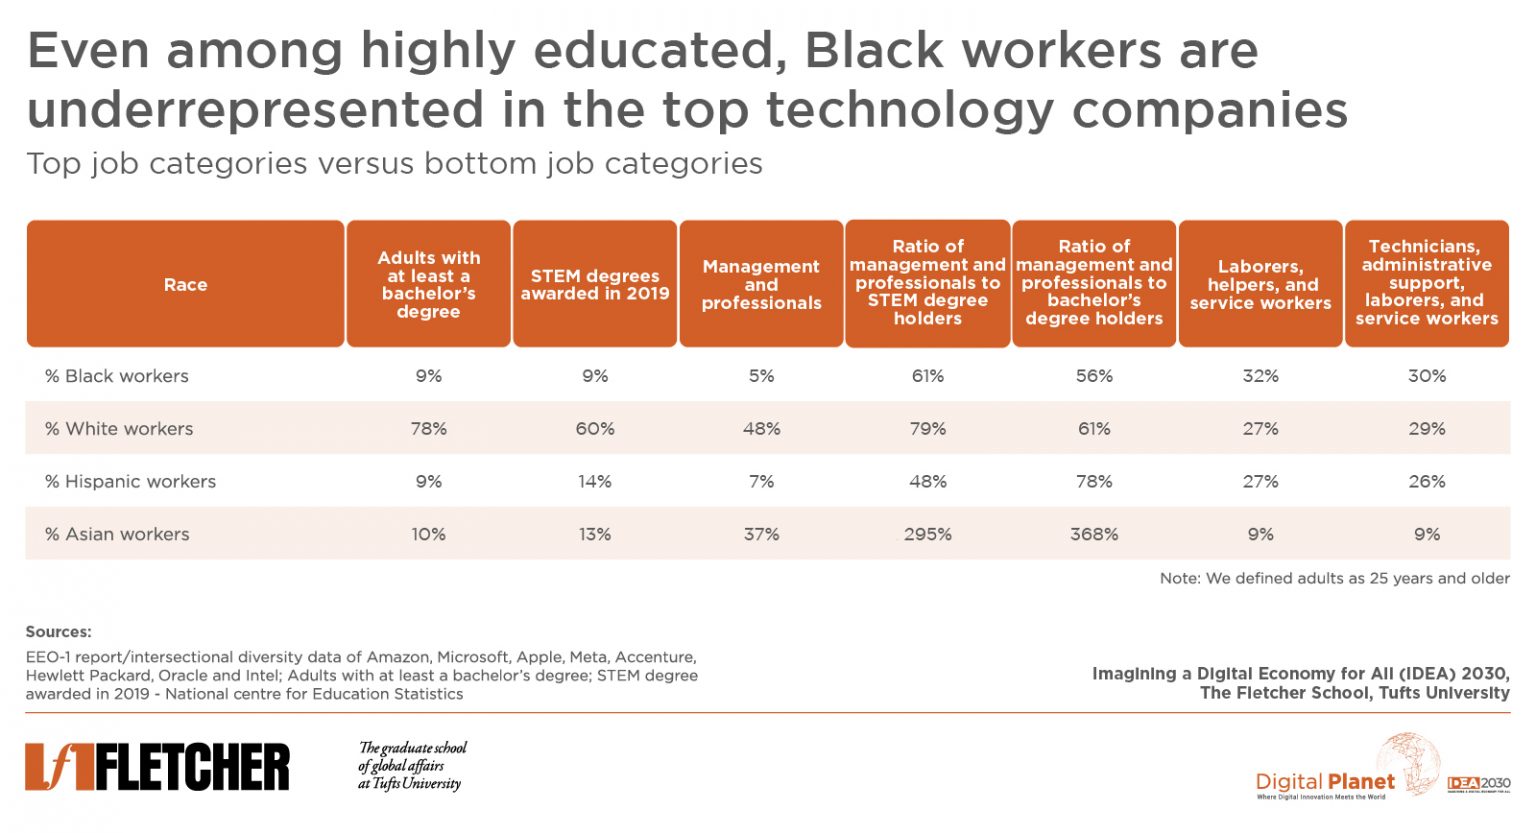
As the table above indicates, even as Black people have made significant progress, a higher education gap remains between them and white and Asian Americans (Hispanic/Latino graduation rates lag Black rates by about 10%). While the cost of college is rising, the evidence is clear—the long-term value of higher education is significant. In particular, STEM bachelor’s degrees are proving increasingly valuable.
The popularity of STEM degrees is growing, among other reasons, due to the changing demands of the economy and the marketability of a STEM degree. STEM occupations pay vastly more than non-STEM occupations (median income of a full-time, year-round worker at least 25 years old is $77,400 while that of a non-STEM worker is $46,900). Yet, when looking at completion of STEM degrees in particular, the racial gap widens further for Black students. Among those who begin college, Black, Latino, and white students express about the same amount of interest in STEM majors, yet Black and Latino students either leave school or switch majors at higher rates. Among the white students who declare a STEM major, 58% go on to complete it, compared to 43% of Latino students and just 34% of Black students. Disparities remain even after accounting for socioeconomic factors, suggesting that the classroom experience needs to be adapted to be more inclusive for all racial groups, and particularly for Black and Latino STEM students.
Black STEM graduates remain underrepresented in the most lucrative fields; less popular and lower paying roles have higher Black representation
For those Black students who persevere to complete a STEM degree, the path to a high-paying job appears more challenging. The proportion of Black STEM graduates securing jobs in teaching and academia and starting small businesses—primarily sole proprietorships—is larger than that of STEM graduates from other racial groups. While technology companies have long blamed a pipeline issue for the lack of diversity, it is apparent that highly-skilled Black professionals are not working in the tech sector at the same rates as their similarly-educated white and Asian peers.
Using data from SeekOut, an AI-powered Talent 360 platform, we collated race profiles for employees within different industries, focusing primarily on STEM graduates across industries.
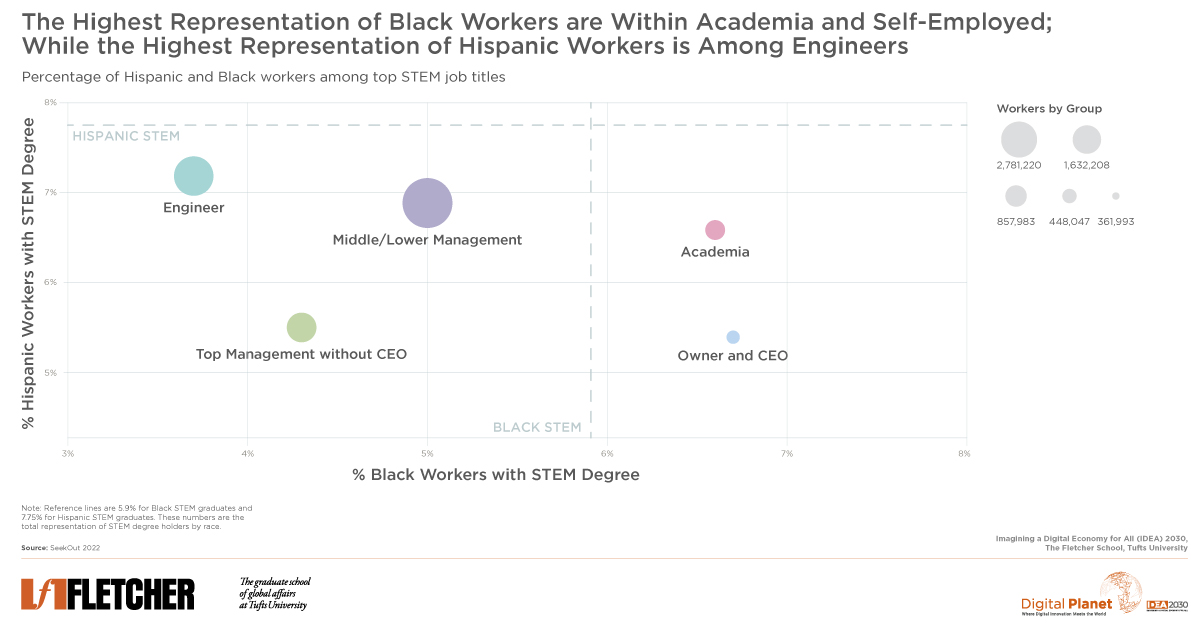
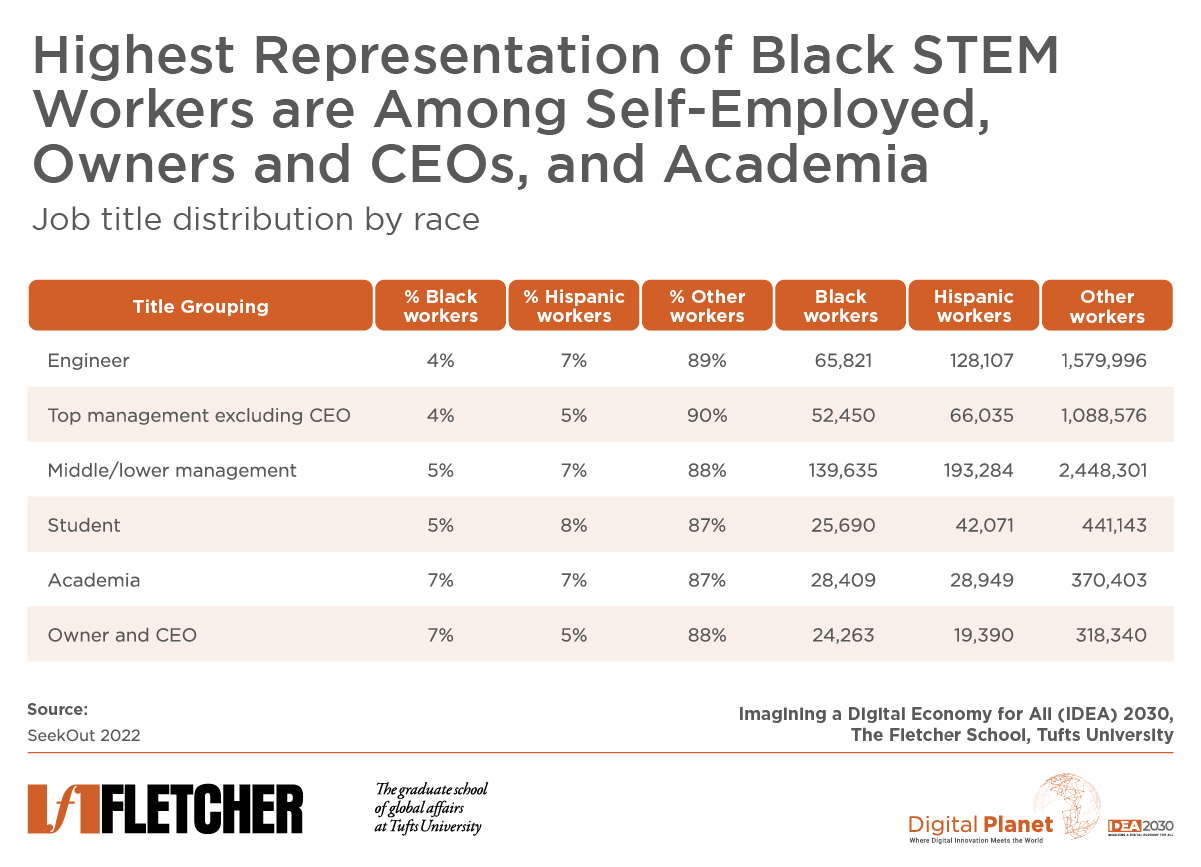
Among the most common job titles on SeekOut, the highest representation of Black professionals (7%) is in academics (teachers, principals, and assistant professors) and business ownership (CEO and owner). Among those with the CEO and/or owner title, it is more likely that they are heading up a small business or sole proprietorship. A recent Brookings analysis finds that most Black-owned businesses are non-employers of labor (11.8% of the total non-employer businesses are owned by Black people but only 2.3% of businesses with at least 1 employee are Black-owned). Therefore, a high representation of Black folks may not necessarily imply higher prosperity.
Academia is one of the lowest paying professions even among STEM degree holders. For instance, an engineering professor earns a median income of $103,600 while the median income of a petroleum engineer is $137,330. This disparity is more striking, given that an engineering professor requires at least 4 more years of education than an engineer (The entry requirement of a professor in a four-year college or university is a PhD or any form of doctorate degree in their field while that of a petroleum engineer is a bachelor’s degree).
Black workers are disproportionately represented among low-paying roles. An estimated 5.9% of STEM graduates on professional networking platforms are Black, but Academia accounts for 7% Black STEM graduates. Academic-related job titles make up 6% (427,761 of 7,060,863) of the job titles we clustered into six groups (engineer, top management, middle/lower management, student, academics, and owner/CEO) in our comparative analysis, as seen in table above. Black professionals are disproportionately represented among the least popular professions among STEM degree holders. The most popular career groups (groups with highest representation of STEM degree holders) are the middle/lower management group and engineering group with 2,781,220 (39%) and 1,773,924 (25%) individuals, respectively. Only 5% of the middle/lower management title holders are Black (6.95% are Hispanic) and only 3.7% of engineers are Black (7.22% are Hispanic). Engineer is the least diverse job title group among the 5 groups we compared. Top management titles have approximately 5% Black representation and 5.5% Hispanics. Only 5% of those that are categorized as students are Black while 8.27% are Hispanics.
Compared to other sectors, the technology sector—despite its high growth rate in jobs and high median wages—has a lower Black representation
Technology, and Finance & Consulting sectors pay the highest wages, have high job growth rates, and are among the largest employers of STEM graduates per SeekOut data; and yet these sectors have very low Black representation, 3.98% and 5.79% respectively. The finance and consulting industry is more representative of Black STEM graduates. Although there is a slightly higher Hispanic representation in these two sectors, it is not commensurate with both the demographics of Hispanics within the US and among STEM degree holders but close to the percentage of Hispanics STEM graduates. Human Resources (HR) and Marketing, on the other hand, tend to employ the least number of STEM graduates overall and rank lower on the wage scale but record among the highest Black representation (9.8%) and second to the highest Hispanic representation. HR and Marketing, Healthcare, and Retail are the only sectors that have a proportional representation of Black STEM degree holders among the seven sectors in our comparison set. Black STEM graduates are severely underrepresented in Technology and Engineering sectors.


Among Technology companies, high-paying roles have low Black representation and vice versa.
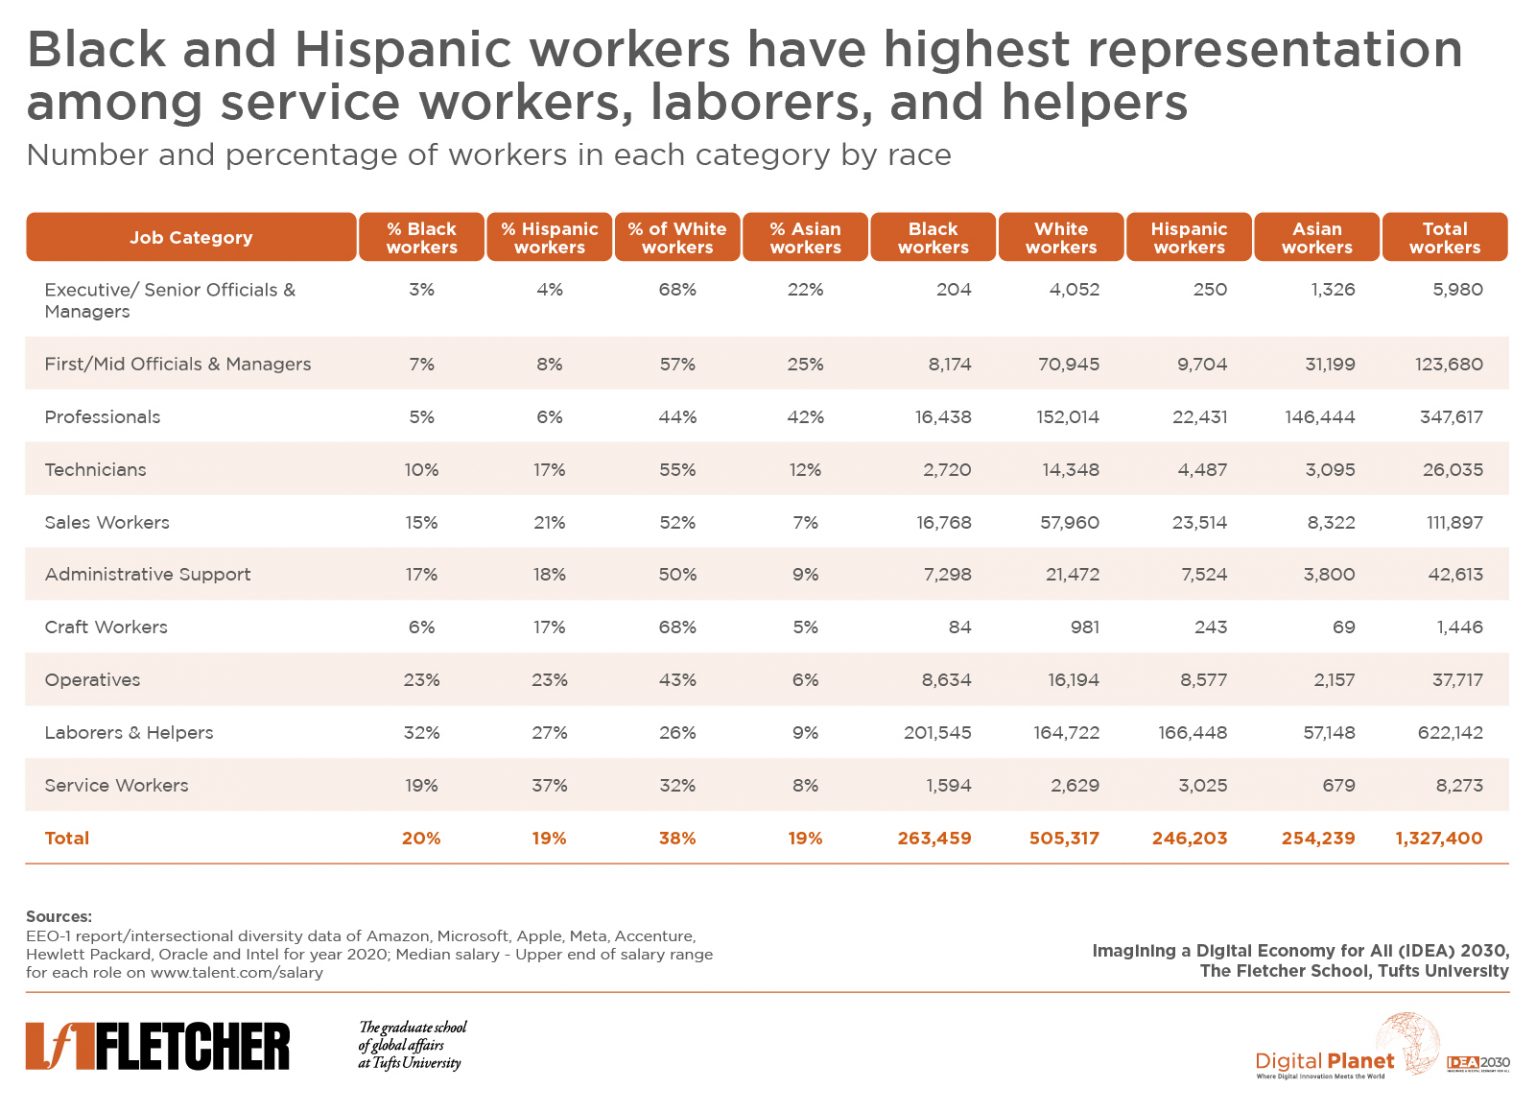
Among the top technology companies, diversity abounds in the lower-paying jobs and at entry levels. Using information from the 2020 Equal Employment Opportunity report (EEO-1) of 8 of the 10 top technology companies (Google and IBM did not publish intersectional data from their 2020 EEO-1 report), we found that even accounting for educational differences, Black workers were under-represented in higher-paying roles.
While high-paying roles like executives and senior officials are held by only 3% Black workers and 4% Hispanic workers, these same roles are held by 22% Asian workers and 68% white workers within these top technology companies. On the other hand, low paying roles like laborers & helpers are held by 32% Black workers, 27% Hispanic workers, 9% Asian workers and 26% white workers. Among those that are categorized as professionals, only 5% are Black workers, 6% Hispanic, 44% white and 42% Asian. Approximately 47% of the jobs in these top technology companies are within the laborers and helper category, while 26% are within the professional category. Also, laborer and helper category have the lowest median salary, highest representation of Black workers and the second highest representation of Hispanic workers (after service workers). While on the aggregate level, most companies seem to hire from minority groups, granular analysis of this kind reveals the true gaps and the fact that most minorities (Black and Hispanic) are mainly in low wage roles.
While employee numbers may show diversity, Black and Hispanic workers are disproportionately concentrated in lower wage roles.
Overall, these top tech companies have lower representation of white people than the country’s demographics, 38% of the total staff are white (this is 22% lower than their demographic share), Hispanic workers have proportional representation, Black workers have 6% more than their demographic share, and Asian workers have 13% more than their demographics. Most of the white representation in these companies is among the highest paying roles, and they are followed by Asians (at 37.5%), while most of the Black people hold the lowest paying roles. The relationship between income and racial representation of Black and white workers is a mirror image of each other. While the percentage of Black professionals declined with an increase in median salary among job categories, the percentage of white professionals increased with an increase in median salaries among job categories.
Low skill roles have high black representation and vice-versa
Among job categories that require low education, roles that required higher level skills have higher compensations, but carry lower Black representation if compared with those that require low skills. Most of the jobs that fall within the craft worker category do not require a college degree although they mostly require skills in a particular field. Craft workers earn about twice more than laborers and helpers which requires little or no skill.
Implications for Action
- Companies should focus on diversity at all levels of the organization
To tackle the diversity challenge in the workplace, decisionmakers need to look beyond diversity at an aggregate level and focus on individual job categories to ensure equitable and proportionate representation at all levels of the organization in line with the demographic makeup of the country. For instance, while Black workers make up 20% of the total workforce in the 8 tech companies, 76% of these Black people work as laborers and helpers. Also, the population of Black STEM degree holders is not a proportionate representation of the demography. Across industries, recruiters in diversity deficient sectors like technology and engineering should expand outreach to qualified Black candidates to ensure greater workplace diversity. With the spread of remote work, companies can recruit from more diverse cities around the country to achieve a more diverse workforce.
- Retention is just as important as recruitment
Black workers in tech have reported feeling less connected, and end up switching jobs more often. A recently released report by Russel Reynolds Associates and Valence found that systematic workplace barriers lead to Black talent in tech moving between companies every 3.5 years to advance, compared to 5.1 years on average for their non-Black peers. Nearly half of Black tech professionals say they must move companies to achieve career growth, while only 28% of non-Black professionals feel the same way. When Google submitted its diversity report in 2018, it highlighted attrition among Black and Latino employees as a major challenge. Given the frustrations of Black professionals in the tech industry, the low Black representation numbers in the industry likely reflect not only a recruitment problem, but also a retention challenge.
- Companies must lead with transparency through publishing their EEO-1 reports publicly, and benchmarking their diversity efforts against their peers
Since 1996, all companies with 100 or more employees in the US are required by law to submit an EEO-1 report to the Equal Employment Opportunity Commission (EEOC). While nearly all the large technology companies publish their own diversity reports, each diversity report approaches diversity data with a different methodology. Publishing the EEO-1 reports allows companies to compare apples-to-apples and benchmark within and across industries on clear measures on diversity throughout multiple levels of the organization. An increasing number of stakeholders have been asking companies to publish this information, including major investors like State Street, who announced recently that they are prepared to vote against board leaders of top companies which fail to disclose these reports. While the share of companies electing to disclose some racial and ethnicity data is increasing (from 32% to 55% just throughout 2021), EEO-1 reports offer specific, intersectional data—plus they require zero effort to publish, since they have already submitted them to the government. Finally, the EEOC should implement adding pay data to the required information submitted in EEO-1 reports, as proposed by the Obama administration.
Methodology
Data was collected using the SeekOut proprietary database. SeekOut, an AI-powered platform for recruiting, uses algorithms to “scrape” publicly available resumes from all over the web. Candidates are not necessarily looking for work and are most often currently employed. We collected data majorly on STEM graduates across job titles and industries by race. “STEM graduates” is defined by SeekOut as those that have a degree in a science, technology, engineering or mathematics field.
To create job title groups, we gathered data on top 25 current titles and similar titles (using similar filters). This returned data on 38% of the total STEM pool. We then grouped them into Owner and CEO, Top management (President, Vice President and Director), Middle/Lower management (Principal officer, consultant, and manager), Engineer, Academics (Teacher, Assistant Professor, and Principal) and Student (student, interns and Research assistant).
For sector/industry data, we collected data on each of the 7 sectors available on SeekOut under power filters. Wage for each sector was estimated by taking the weighted average of wages from BLS (Occupational outlook handbook) for top titles in each sector (we mostly considered the top 3 titles, but that number also depended on availability of data). We used proxies for some sectors e.g., for consultants we substituted with management analyst for the purpose of estimating wages.
For top tech companies, we selected the top 10 tech companies on SeekOut. We gathered each company’s diversity data from their EEO-1 report or similar intersectional data for 2020. Although the EEO-1 report is a mandatory report that every company with more than 100 employees submit to the EEOC office, companies are not mandated to publish this report. The EEO-1 report grouped over 2000 job codes and titles into 10 job categories. Tech companies are more willing to publish their EEO-1 reports than other sectors compared, yet they seem to be less diverse than most sectors. The tech companies included are Amazon, Microsoft, Apple, Meta, Accenture , Hewlett Packard, Oracle and Intel. Although Google and IBM were among the top tech companies, they did not publish their 2020 EEO-1 reports nor provide enough detailed, comparable intersectional data for the analysis in this study, therefore they were excluded. Google’s most recent 2021 Diversity Annual report links back to their 2018 EEO-1 report. IBM has committed to publishing their EEO-1 report in 2022.
We created a general tech industry category comprising these 8 companies.
For salaries of each job category, we used the upper end of the salary range provided for each category on talent.com. We also compared managers and professional group, top paying and degree requiring roles (Executive/Senior Officials & Managers, First/Mid Officials & Managers and Professionals) with lowest paying roles (Laborers & Helpers and Service Workers)
Note, the median salary range on Talent.com is for each job category but across sector, since tech sector is one of the highest paying sectors, we used the upper end of the salary range. These median salaries are conservative for these top tech companies.
All data and sources are available for download here.
Graduate Research Analyst Tint Tel May worked on this analysis under the guidance of Abidemi Adisa, Ravi Shankar Chaturvedi, Christina Filipovic, and Anuradha Herur at Digital Planet, The Fletcher School, Tufts University.
This research is a part of the IDEA 2030 initiative, made possible by the generous support from the Mastercard Center for Inclusive Growth.


