


The Emerging Geography of AI:
Introducing the Top-Ranked AI Nations (TRAIN) Scorecard
As competition intensifies in the global race for AI dominance, we mapped the emerging geography of AI leadership across four main drivers: data, rules, capital, and innovation.
On November 30, 2022, OpenAI released ChatGPT. Five days later, the chatbot had over a million users. By late 2023, one year after release, it boasted an estimated 100 million active monthly users, all while the major players in tech released their own chatbots. While AI had been a hotly debated topic in investor, tech, and policy circles for some time, 2023 will be remembered as the year it exploded into the public’s consciousness.
The promise of AI is coupled with important, challenging questions—for governments, societies, and companies—which became more urgent in 2023. As the global competition for AI leadership heats up, an emerging geography of AI is forming. This race will determine which applications get priority, where innovative capacity and investments can be focused, what regulations emerge, what risks might arise, and how competitive innovation is balanced with safety and public oversight.
The TRAIN Scorecard
Building on our 2021 work identifying the top 50 global hubs for AI talent, and our 2019 work on measuring “gross data product,” we created the Top Ranked AI Nations (TRAIN) Scorecard to evaluate where 25 leading AI creator countries stand in the race for global leadership.
To compare AI across countries, we considered four drivers:
Data — volume and complexity of the core resource used to train and improve algorithms.
- Broadband Consumption, Aggregate (Fixed and Mobile): the overall data consumption in a country.
- Broadband Consumption, Per Capita (Fixed and Mobile): data usage per internet user in a country and serve as a proxy for how complex the data is representing different kinds of uses
Rules — how data can be accessed.
- Open Data Participation: the degree to which an economy promotes the use of and access to public data sources.
- Data Governance Policies: the country’s regulatory approach to data — personal, non-personal, open, proprietary, public and private — particularly with respect to privacy protections.
- Cross-Border Data Flows: the degree to which an economy promotes and engages in data flows with other economies, as well as the degree to which an economy actively localizes data within its borders.
Capital — the human, financial, diversity and digital foundations for building AI.
- Talent: the quality and quantity of AI talent available.
- Investment: investment flows into AI and emerging technologies.
- Diversity: diversity of AI talent
- Evolution of the Digital Economy: the evolution of a country’s digital foundations, including computational capabilities
Innovation — advances in AI models, techniques, creative sourcing of data, and new applications.
- Number of Patent Applications: the number of patent applications from each country in AI related technologies.
- Number of Citations for Top 10 AI Papers: the total number of citations accrued by authors from each country.
- Aggregate AI publications: the total number of publications in the field of AI in each country.
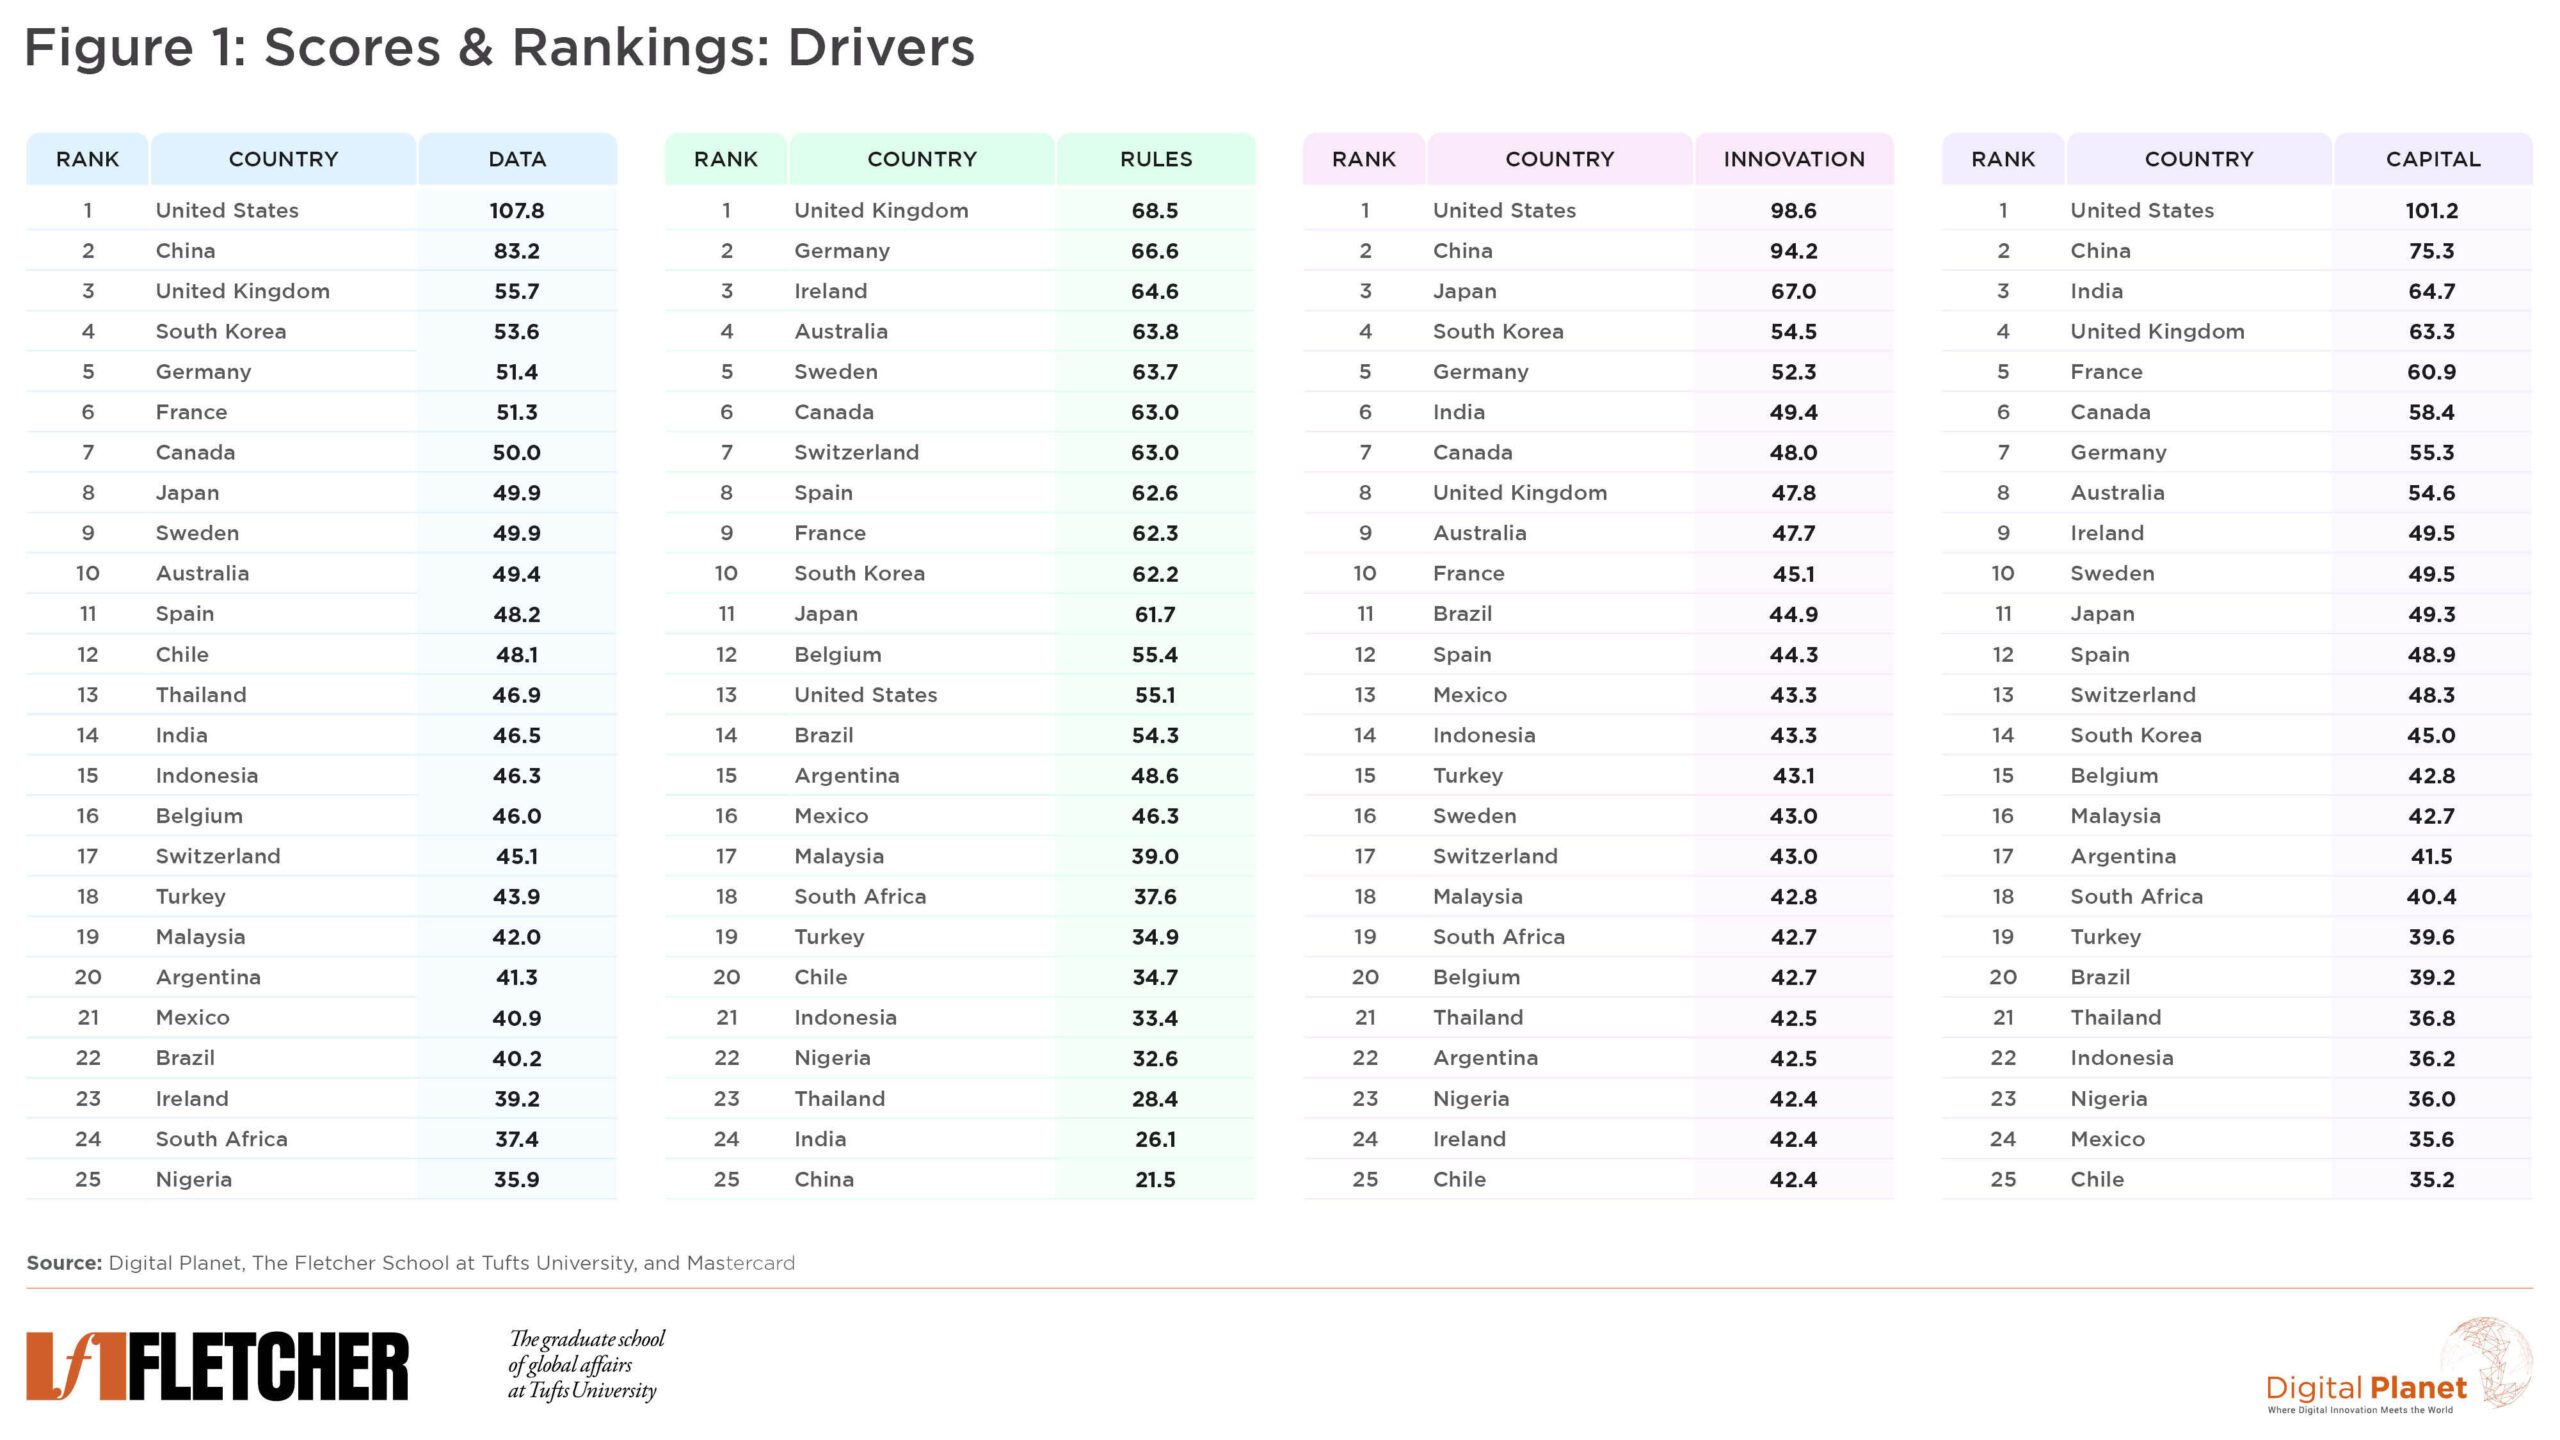
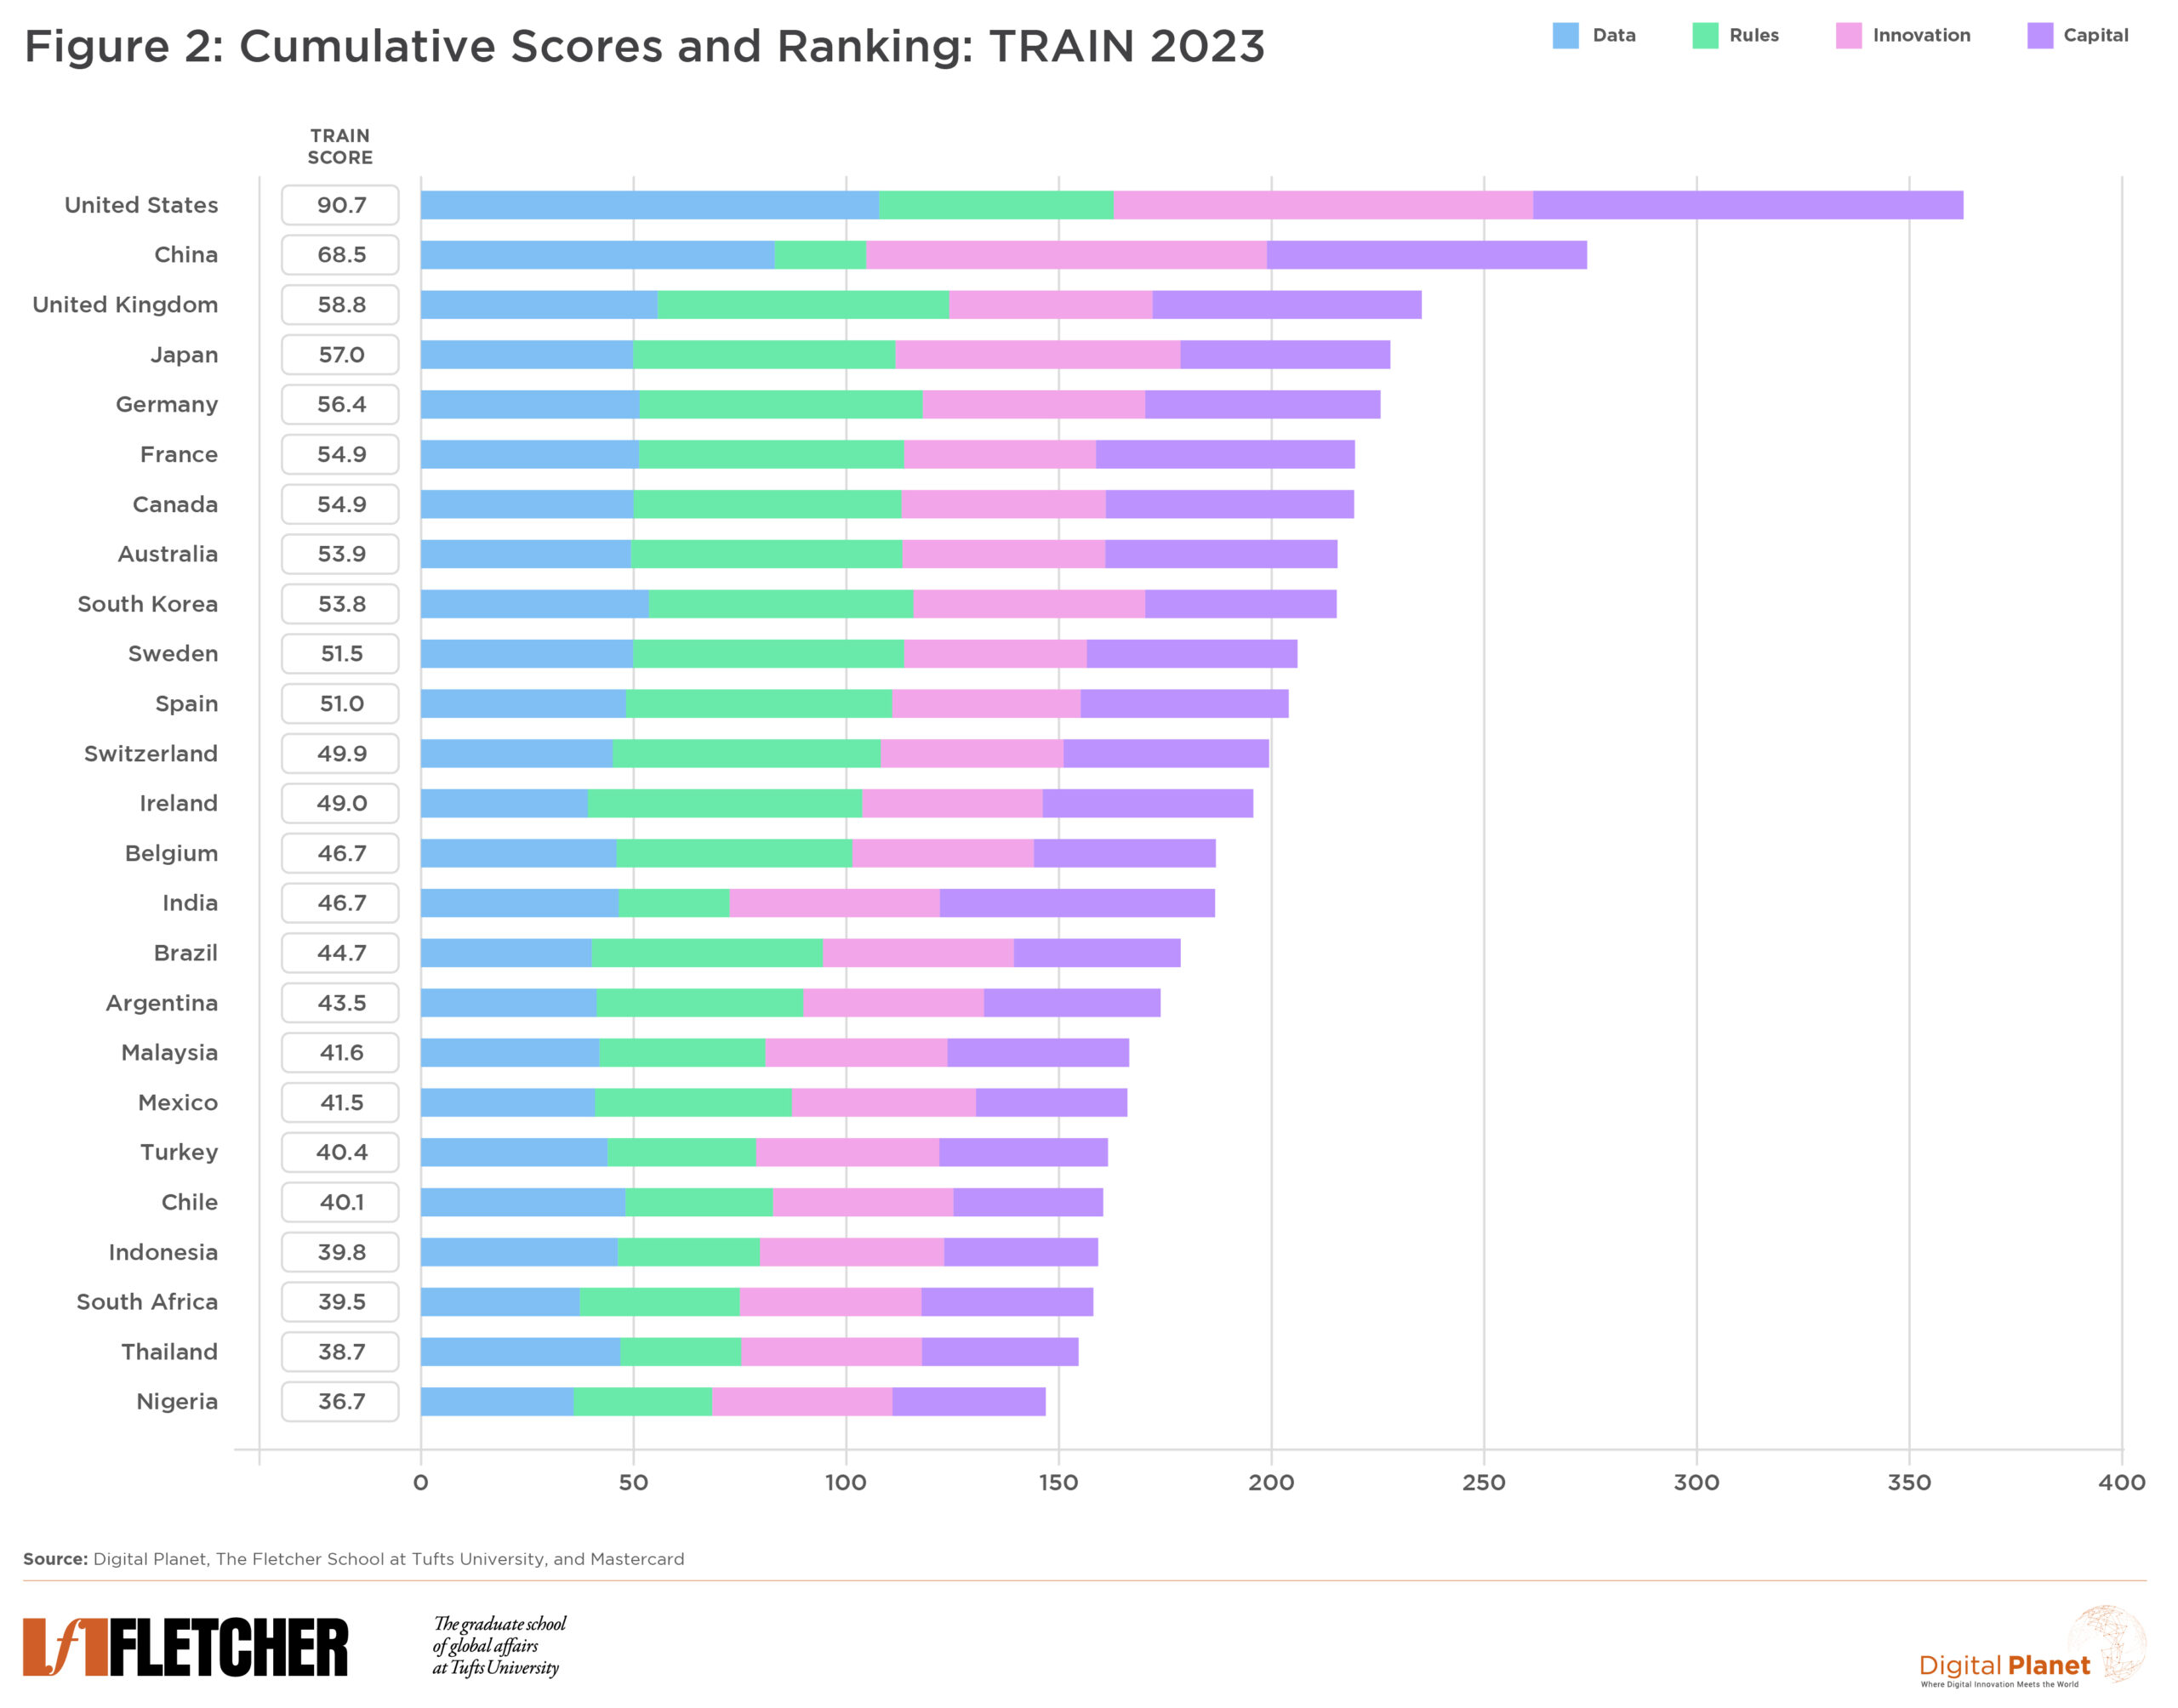
The four driver scores (Figure 1) are combined equally into a final TRAIN score (Figure 2).
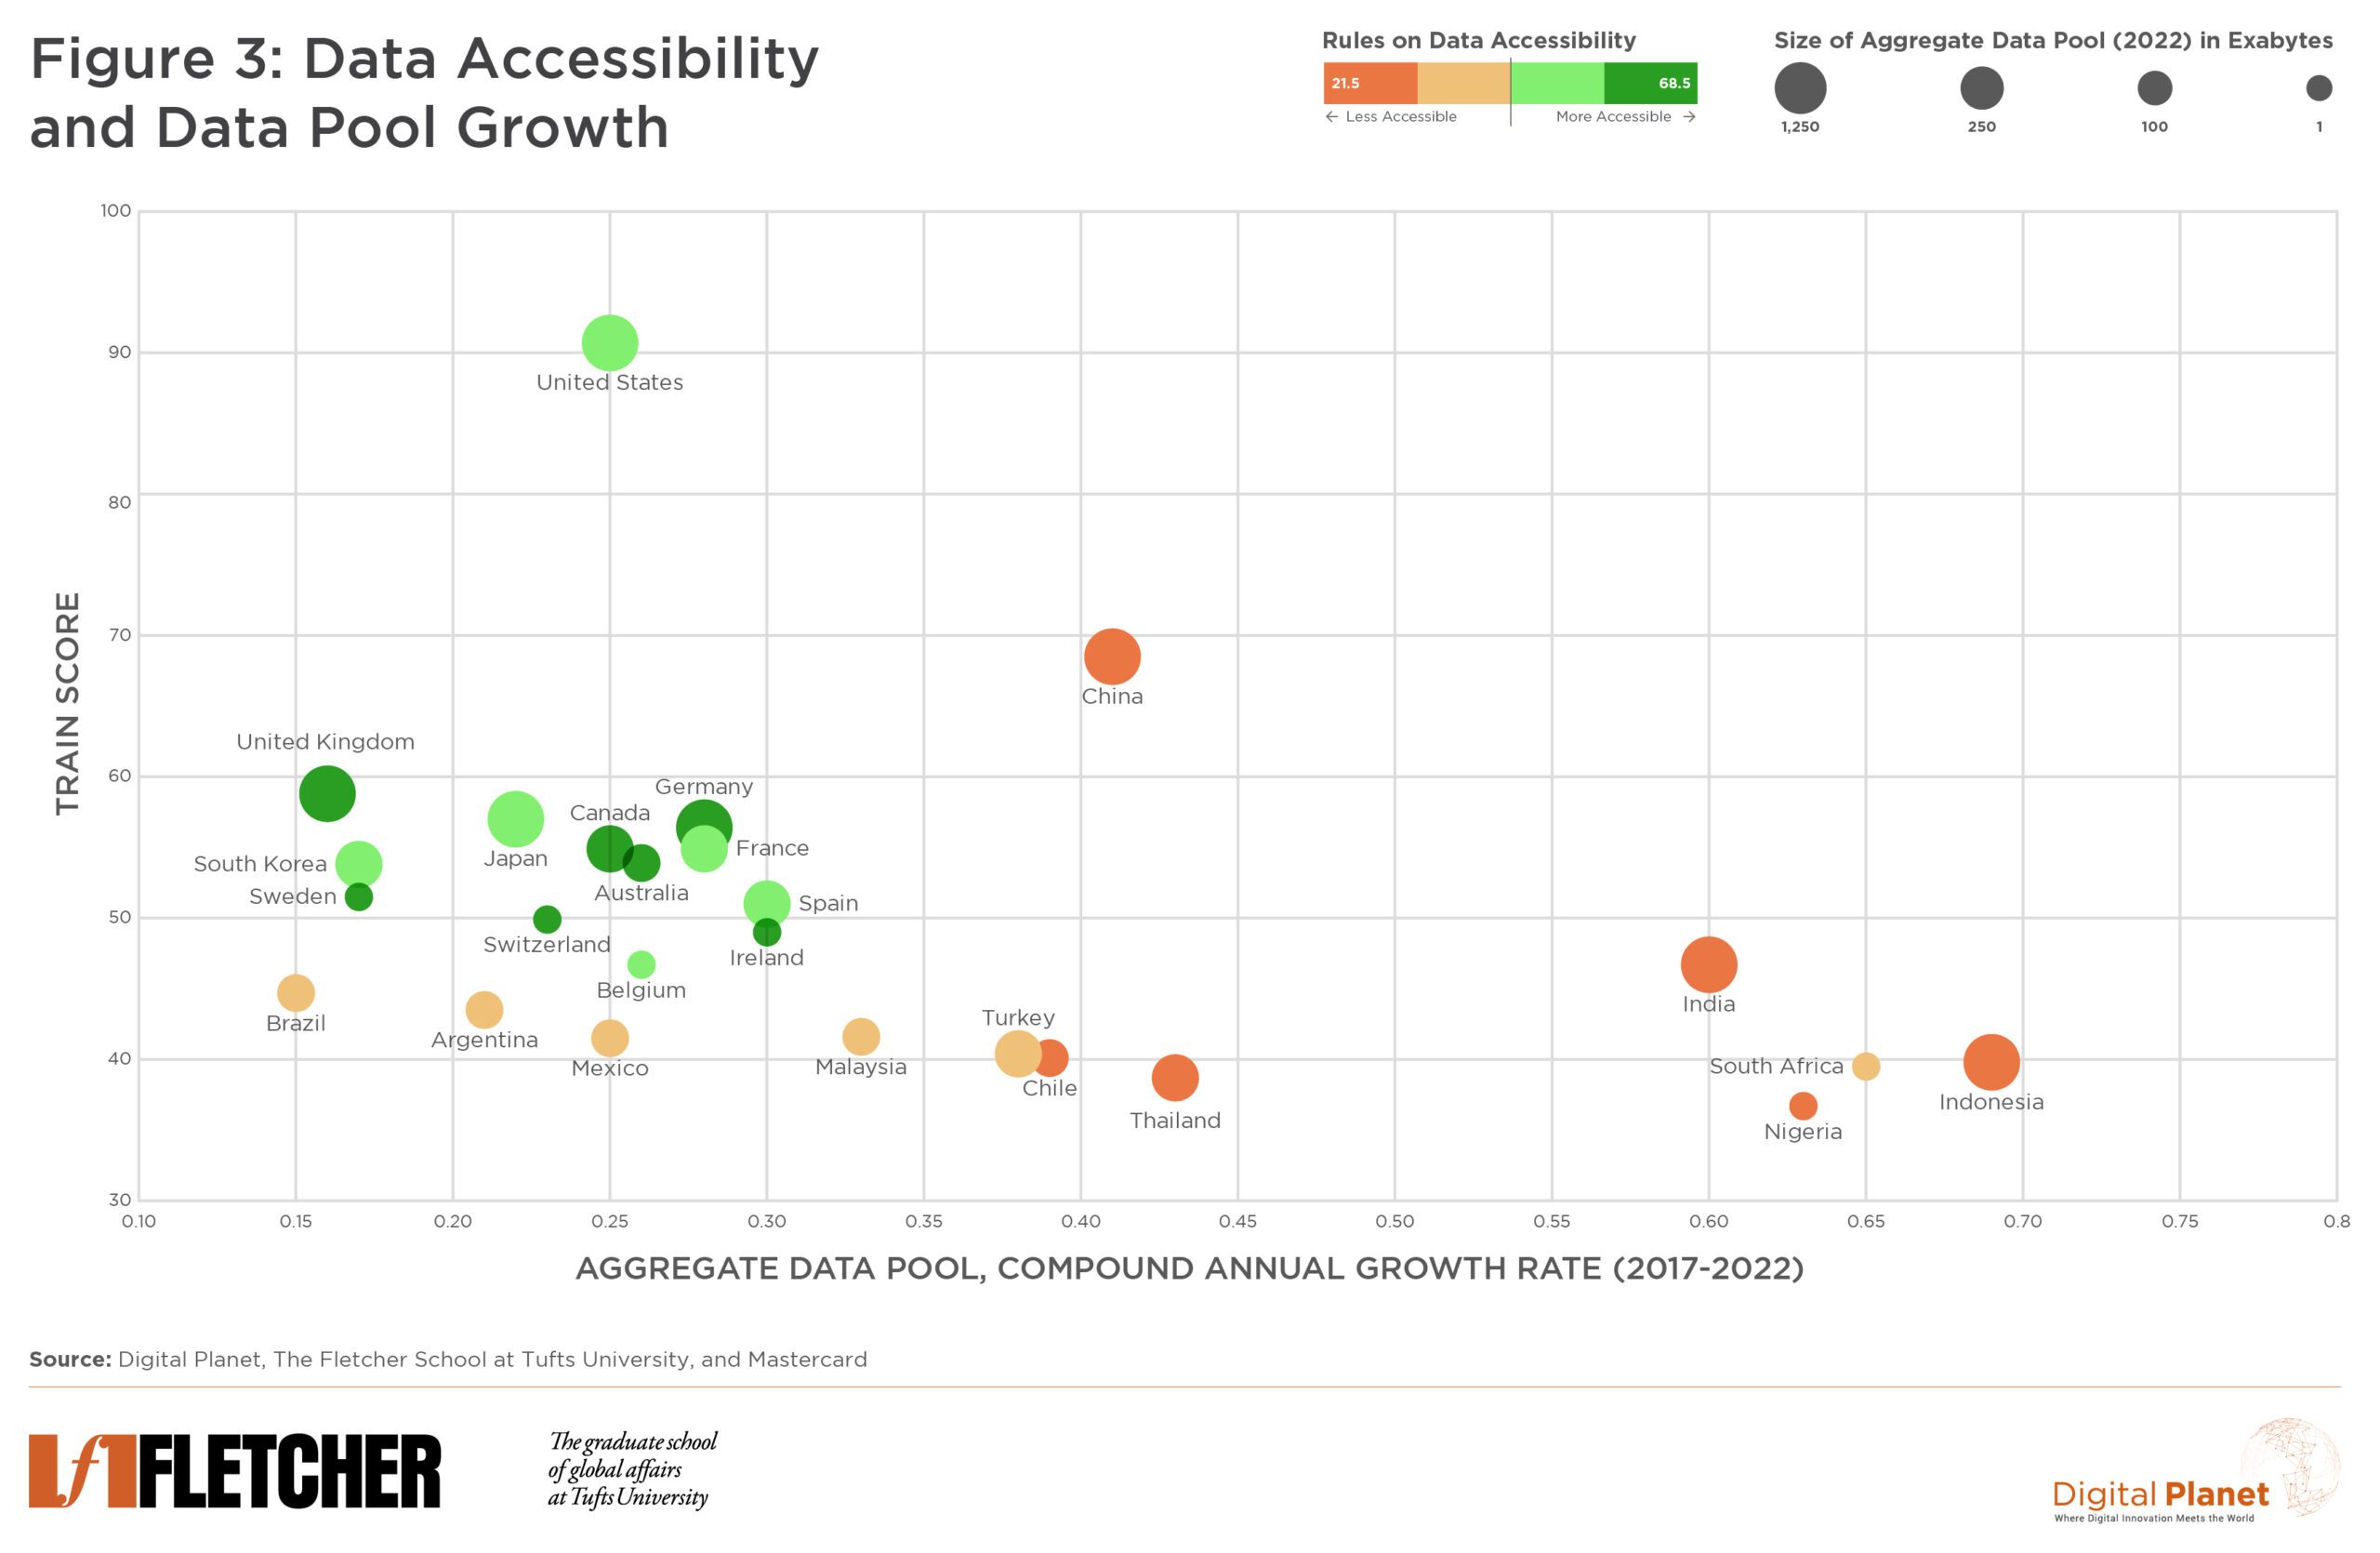
The fastest growing data pools are also the least accessible.
Of all the drivers that are crucial for AI leadership, the changes in accessible pools of data are likely to have the greatest impact on the positionings across the 25 countries in the near to medium term. One key insight which emerged is that the fastest growing data pools—like those in India, Indonesia, South Africa, and Nigeria—are also the least accessible. Companies would do well to watch for changes in data regulations and policies around the world, while policymakers must balance retaining AI competitiveness in innovation while protecting the public.
Read more insights on our TRAIN scorecard in our Harvard Business Review article, Charting the Emerging Geography of AI and sign up for our monthly Dispatches from the Digital Planet for additional analysis on global AI trends and more.
Methodology
The Emerging Geography of AI represents a data-driven evaluation of four core factors to AI competitiveness, using 45 indicators sourced from public and proprietary data, integrating them into four key drivers: Innovation, Capital, Rules, and Data.
To paint a composite picture of the geography of AI, the Scorecard tracks 45 indicators to measure the forces driving the development of AI. It is structured at three levels: indicators (available in the downloadable data file below), clusters, and drivers.
Indicators are standardized and aggregated up into clusters, which indicates 12 aspects of AI development status. These are subsequently consolidated into four drivers. A visual representation of our Scorecard is displayed below:
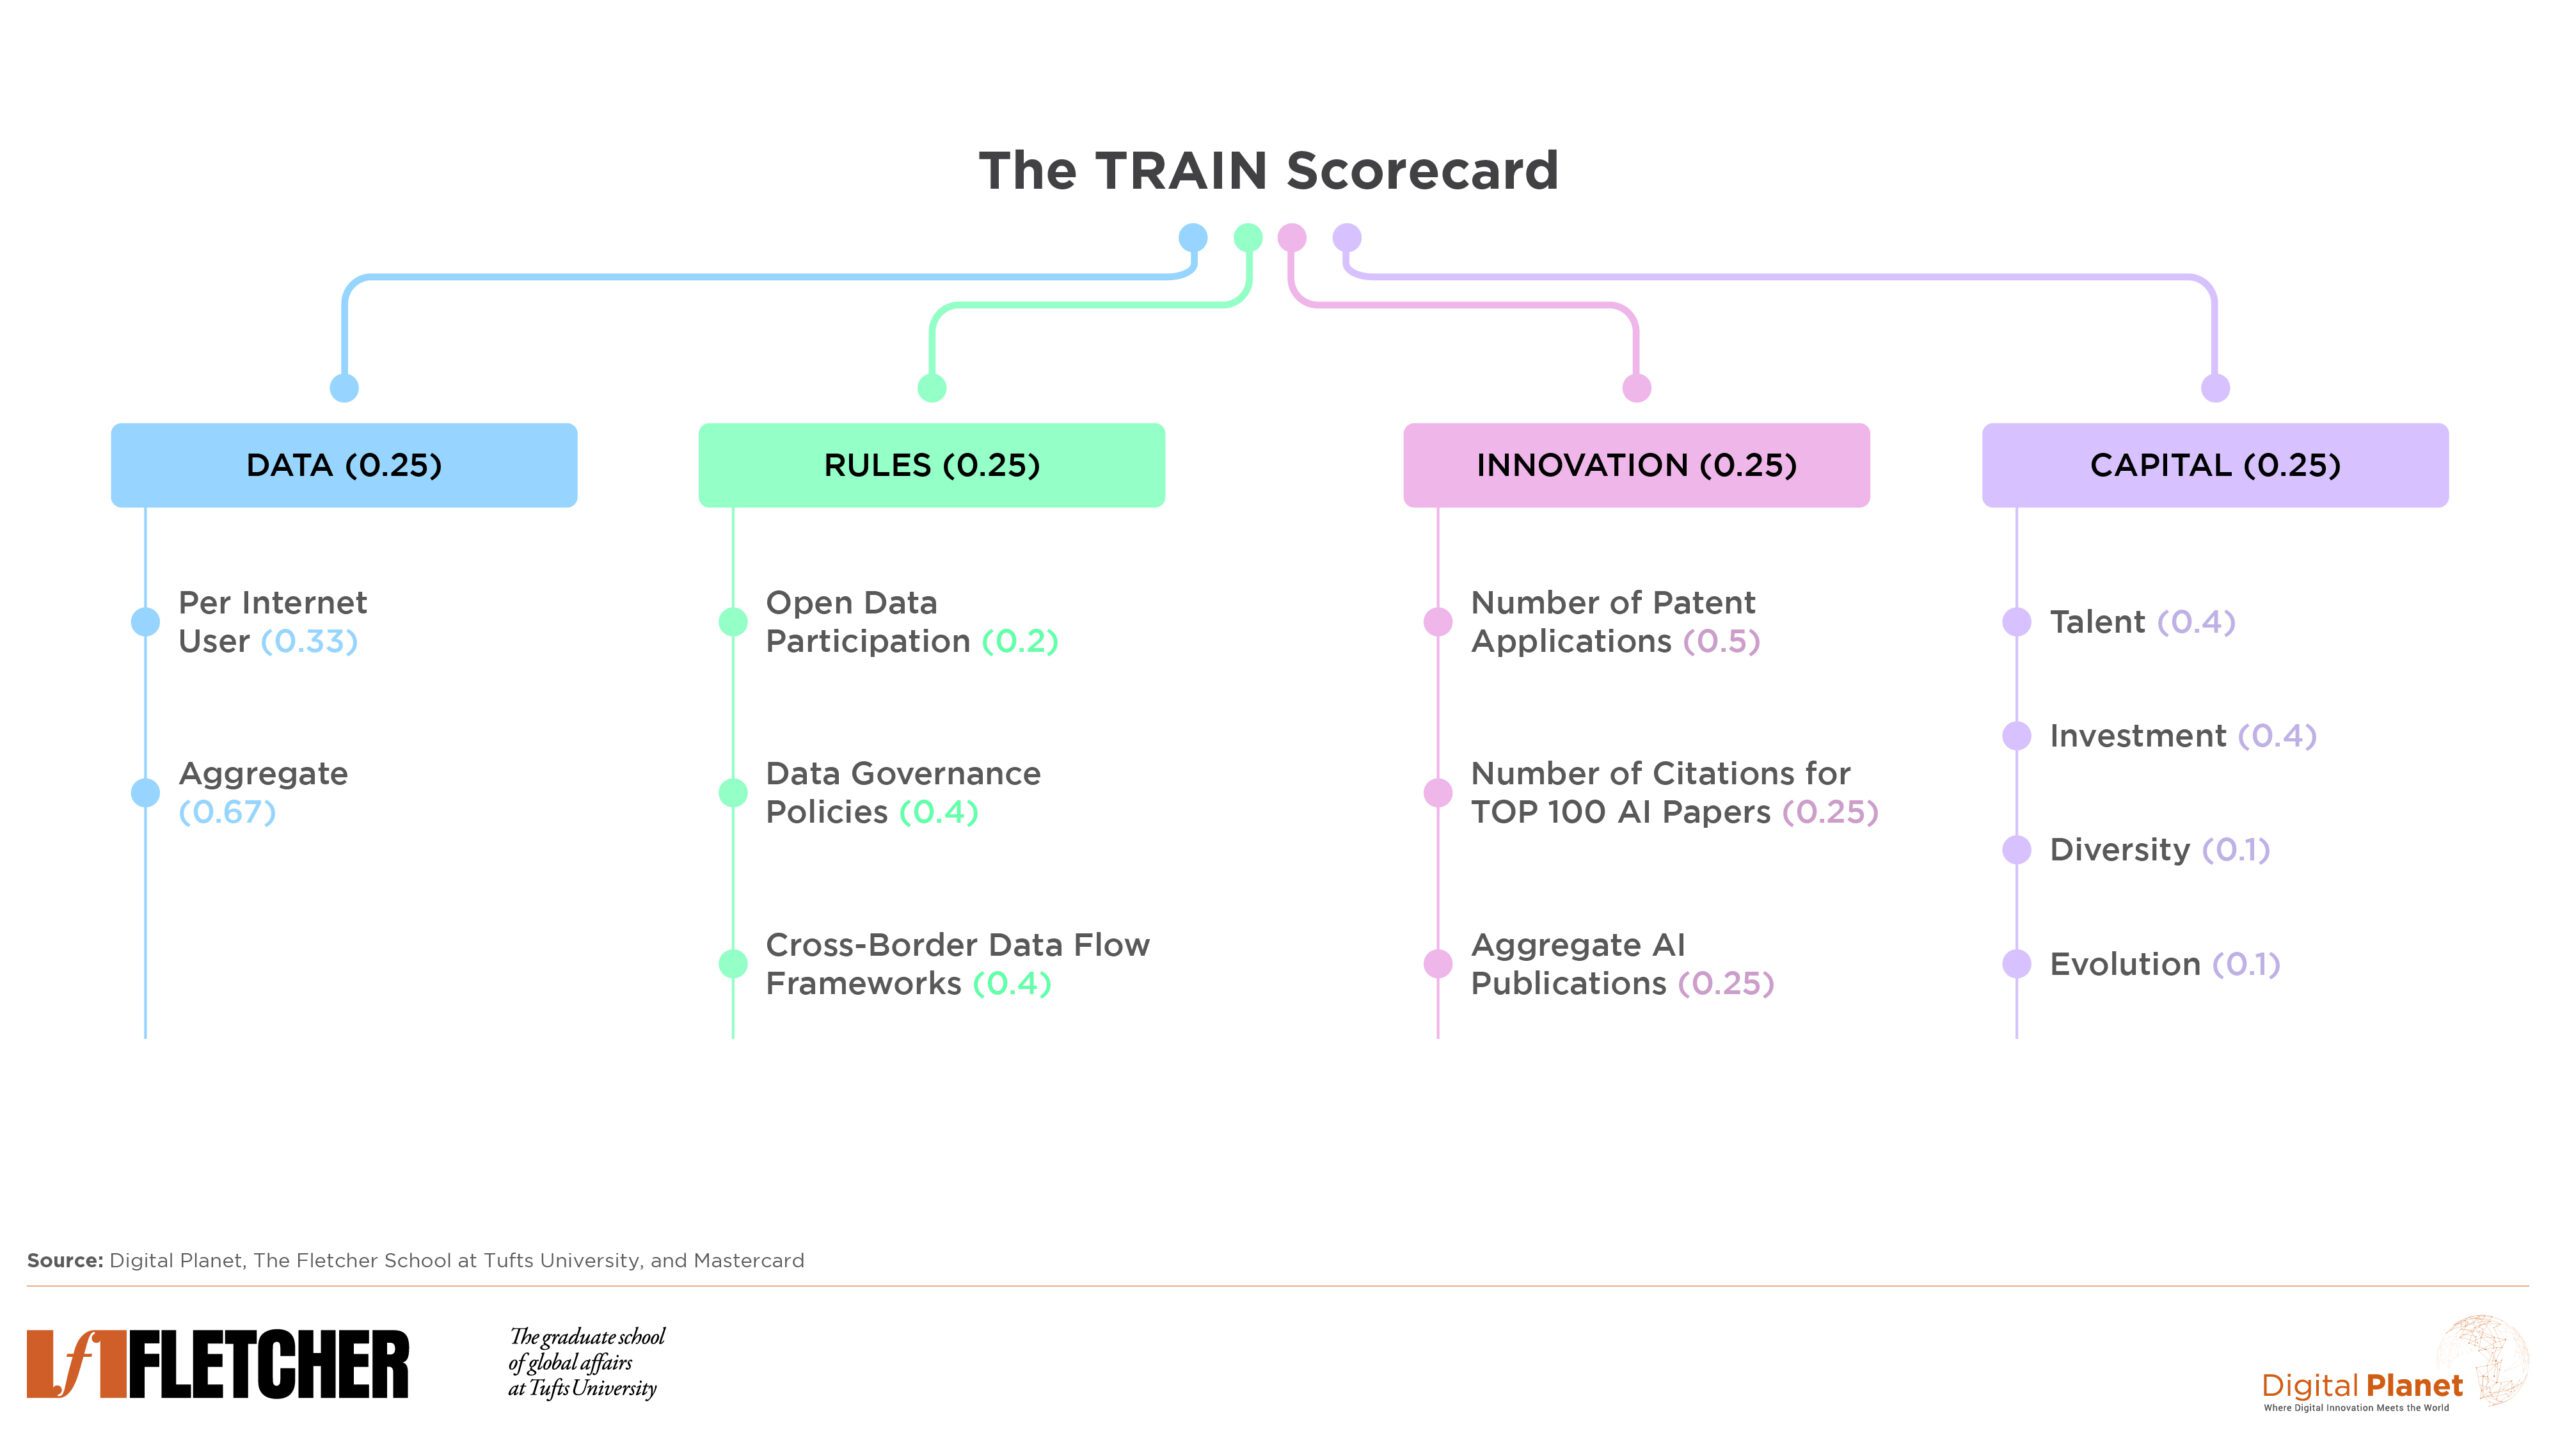
To calculate scores for each driver, indicator values are standardized into z-scores. Our normalization method sets the mean to 50 and the standard deviation to 15. They are then weighted proportionally to the quality of the data and their centrality to the relevant overarching cluster. A fundamental hypothesis of our Scorecard is that AI development of an economy is governed by four drivers of equal importance: Innovation, Capital, Rules, and Data. As such, our model assigns equal weights to all four drivers. Finally, standardized, weighted indicators are aggregated together.
Data pool momentum scores are generated by applying the compound annual growth rate formula (CAGR) on aggregate data pools from 2017-2022.
To ensure the derivation of the most robust and all-encompassing figures, we implemented various quality assurance steps during imputation, weighting, standardization, and aggregation to maintain the scorecard’s validity and robustness. By employing statistical techniques such as variance analysis, regression analysis, and predictions, we conducted thorough stress-testing of the scorecard at several stages.
Digital Planet Research Analyst Iris Niu worked on this analysis under the guidance of Bhaskar Chakravorti, Ravi Shankar Chaturvedi, and Christina Filipovic. Student Analysts Max Agigian, Urvashi Chopra, Stella Henderson, Elena Latzen, and Mai Nagabayashi contributed to this research.


