Home > Off the Charts > Uneven State of the Union
Work from Home or Out of Work?
Digitally ready states were able to implement strict social distancing policies in the early days of the COVID-19 pandemic, with relatively less impact on their employment numbers. While all states experienced economic hardship and a drastic increase in unemployment, those states which were least digitally ready and instituted stricter social distancing measures experienced the most painful unemployment levels, with a higher percentage of their workforce falling out of work.
Key Observations and Insights
In the first phase of our research on the Great Lockdown’s impact on U.S. states, we examined how states differ in their responses to and containment of COVID-19. Now, we ask which states are (not) digitally ready to work from home?
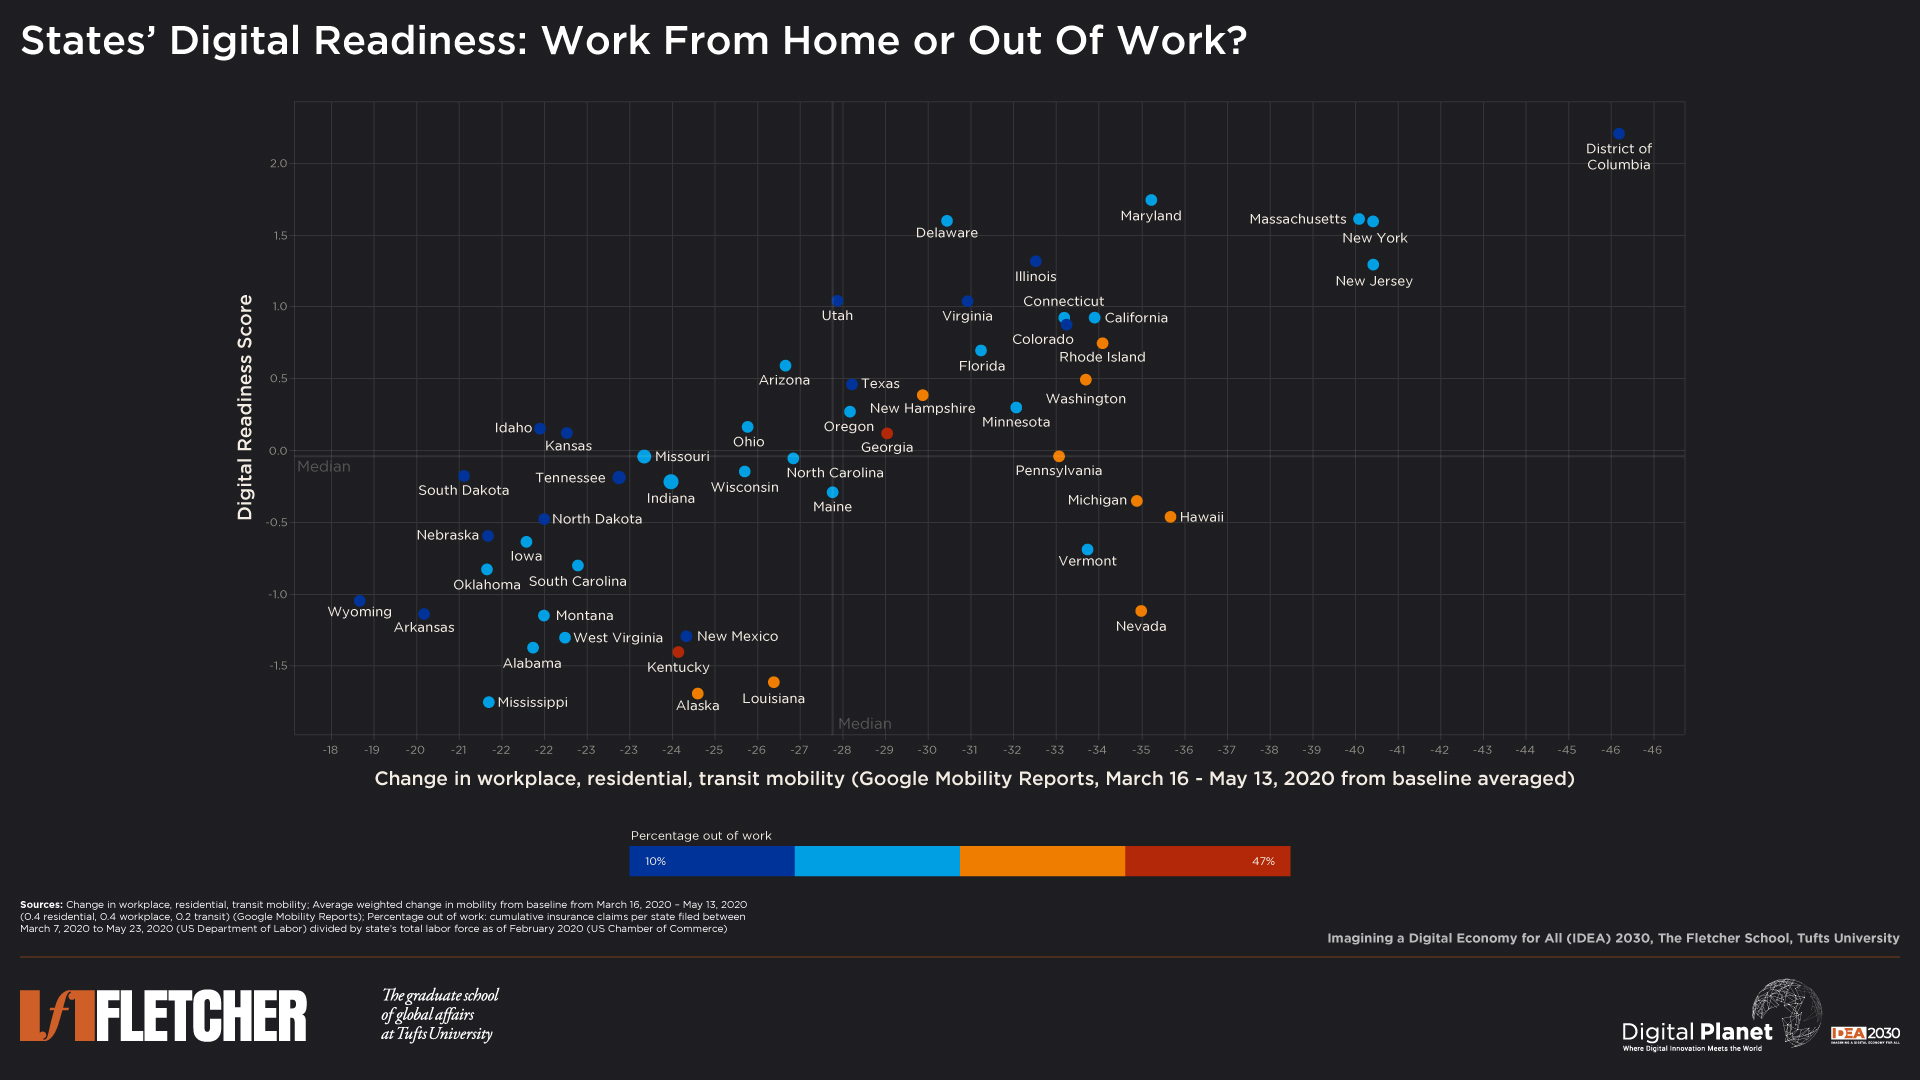
We scored and arrayed all 50 states and the District of Columbia on their digital readiness—including work from home capabilities, inclusive internet, and digital public services—and social distancing. Additionally, we wove in measures on unemployment insurance claims and the share of the labor force that is newly out of work to provide additional insight into states hit hardest by job losses.
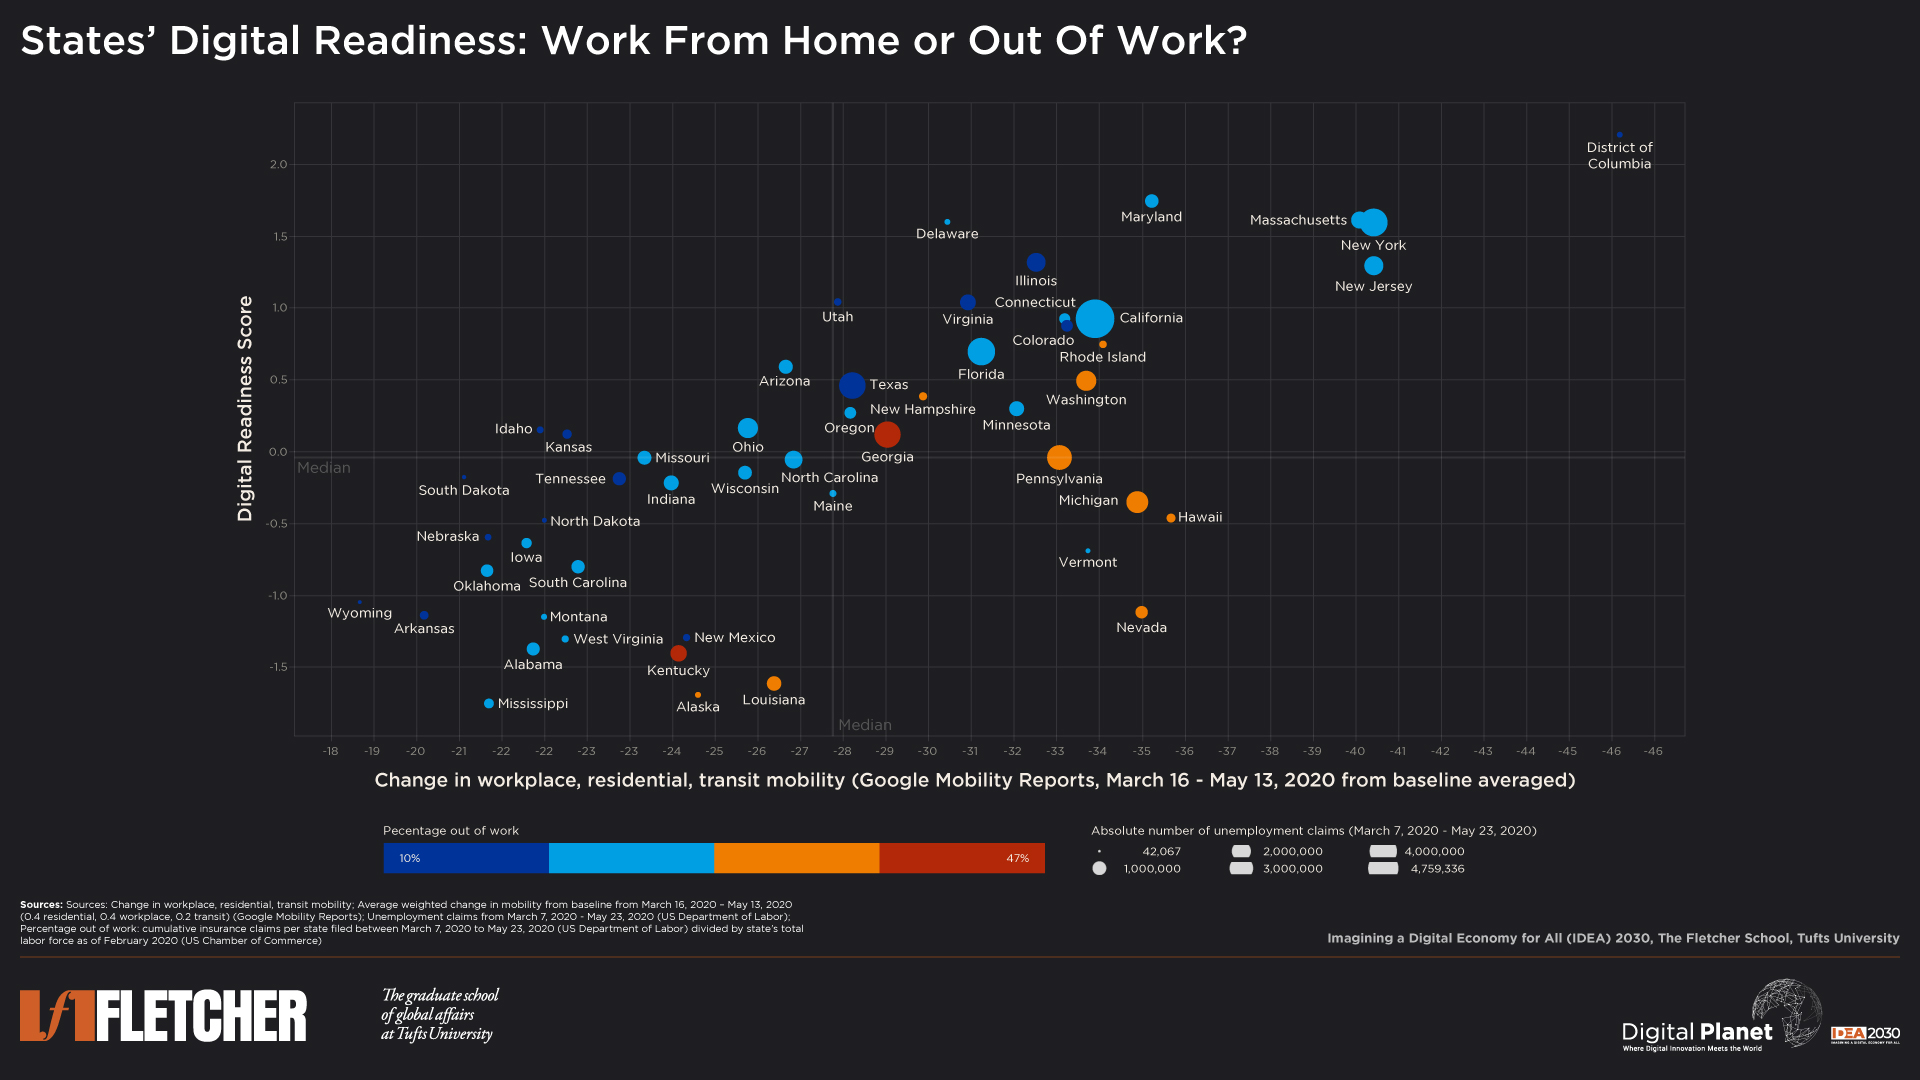
A look at the scatter plot above shows a strong positive correlation between digital readiness and a change in workplace, residential, and transit mobility; states possessing a greater capacity to work from home adopted stricter social distancing—perhaps because they could afford to do so. More interesting, however, are states towards the bottom-right; remarkable for instituting decent-to-diligent social distancing measures despite not having an adequate digital infrastructure in place and the types of jobs and industries that lend themselves well to remote work. Furthermore, because of the high-touch nature of many of the jobs in these states, work-from-home was simply not an option for many workers or their employers, resulting in higher rates of unemployment.
High touch services jobs – as found in industries such as restaurant, retail, and tourism – exist in sizable numbers across all states. Due to this reality, even the most digitally ready states could not escape large numbers of unemployment claims (as seen by the bubble size, which measures the absolute number of unemployment claims by state). These high touch services jobs, particularly in states with high digital readiness, are built around volitional socializing and to support the needs and lifestyles of workers in high-tech and other information-based industries; every one high-tech job, studies show, creates 4.3 high touch jobs in the local economy. Employment multipliers i.e., indirect jobs created and supported by anchor industries, tend to be higher for information-based businesses. As the tech and professional services sectors easily move to work from home during a pandemic, those with high-touch jobs – like dentists, retail store clerks, and cooks – find themselves left behind and out of work.
Washington’s Food & Beverage Layoffs Overpower Work from Home Capacity
Despite having relatively strong digital readiness with Seattle’s high concentration of tech employment, close to 37% of Washington’s labor force were out of work—a clear example that a transition to work from home infrastructure may be seamless for information services professionals, but has cascading reverberations throughout the rest of the economy. The state closed all bars, restaurants, and recreation facilities on March 16, resulting in 100% of bartenders, 58% of food counter or café attendants, and 51% of waitstaff filing for unemployment between March 8 and April 25. This alignment between non-essential activities and social distancing demonstrates how particular industries are prone to greater distress during the pandemic, even if the state is largely capable of moving online.
An Out of Work Struggle for Georgia
Georgians have suffered dearly during the lockdown, with over 47% of the labor force filing for unemployment—the highest overall. The leisure and hospitality industry accounts for 11% of the state’s workforce, but with widespread closures to curb the spread of coronavirus, it witnessed a 42.4% year-to-year decrease in jobs. Retail trade and social assistance make up another 11.1% and 12.5% of jobs, but 170,000 and 150,000 workers are now unemployed, respectively. With Georgia’s economy reliant on industries that all but came to a standstill, such as air travel—Delta Airlines is based out of Georgia and employs over 36,000 people—social distancing measures hamper non-tech and high-touch jobs disproportionately.
Tourism Falls, Unemployment Skyrockets
As a service-oriented state, Hawaii is heavily reliant on its $18 billion tourism industry that accounts for over 26% of all jobs. With stringent stay-at-home orders shuttering recreation facilities, retail stores, and dining establishments, 37% of the labor force found themselves out of work. The state’s negative digital readiness score and strict social distancing, combined with a reliance on industries that are not conducive to work-from-home (tourism, hospitality, and leisure), triggered more than a 77% decrease in employment across the accommodation, recreation, and retail trade sectors.
Similarly, Nevada’s unemployment rate stands at 28.2%—the highest in the country—with hotels, casinos, restaurants, and tourism-related businesses seeing job losses close to 41% year-to-year. Again, the leisure and hospitality industry has been hit hardest, particularly in Las Vegas, with around 36.1% of the sector’s labor force losing employment.
Decent Social Distancing, but Low Digital Readiness to Accommodate Workers
Around 44.2% of Kentucky’s labor force filed claims for unemployment insurance in the weeks ending March 7–May 23, this time affecting the state’s manufacturing-centric economy that accounts for 12.9% of non-farm employment. Toyota and Ford (employing more than 20,000 workers between them) temporarily closed their plants in mid-March, creating upstream ripple effects in the supply chain for other small businesses in the automotive industry. Manufacturing presents considerable challenges to working remotely, resulting in higher rates of joblessness.
Pennsylvania is in a similar boat, with an early stay-at-home order issued in March idling most construction sites—contracted employees who are understandably unable to work from home. The state saw a 39.4% drop in jobs from April 2019 to April 2020 in construction.
Lastly, another auto-manufacturing and construction haven, Michigan, experienced a 29.4% and 41.6% decrease in jobs year-to-year respectively, with 34% of the labor force out of work overall. With manufacturing making up 20% of Michigan’s economy and 14% of its workforce, it is no surprise that the state’s stringent stay-at-home order and social distancing forced hundreds of thousands to file for unemployment insurance.
In conclusion, this analysis provides insights into a state’s digital readiness and capacity to work from home—factors that are partly determined by the economy’s industry composition. States with higher concentrations of their labor force in high-touch jobs—in tourism, leisure and hospitality, manufacturing, and construction—and that enacted strict social distancing, notably suffer from greater levels of job losses. As states begin to re-open, look to those most out of work to lead the charge, but expect unemployment to endure as professional services and tech firms continue to work from home as people grapple with the degree to which they are willing to venture out.
Research Methodology
Index compilation methodology for scores follows the guidelines laid out by the OECD in their gold-standard Handbook on Constructing Composite Indicators. Weights for the indicators, clusters, and component hierarchy were assigned according to expert input under a budget allocation process (BAP).
Digital Readiness Score
While only part of any economy’s work can be done remotely, Digital Planet examined the 50 states’ “digital reflex” by compiling a Digital Readiness Score for each state plus the District of Columbia. The Digital Readiness Scores are constructed using two indices:
- Work from Home Readiness; and
- Inclusive Internet and Digital Public Services
Work from Home Readiness
In a post-pandemic world, remote working could become the new norm for many people. Realizing that not everyone can work from home, the Work from Home Readiness Index was developed using a range of indicators to assess the extent to which each state’s selected labor force could work from home. Some key measures include the state’s proportion of essential workers, access to technology devices at home, estimated share of the labor force that can work remotely, percent of the population that holds a bachelor’s degree or higher, unemployment claims since March 1, 2020, and the size of the information and services industry. Please refer to the datasheet for a full breakdown of indicator inputs, sources, and weights.
Inclusive Internet and Digital Public Services
While the capacity to work from home is more important than ever, citizens must also be able to access these services reliably, with affordable, and inclusive internet. Broadband coverage, quality, and equity are important prerequisites for remote work. We captured inclusive and affordable internet using BroadbandNow’s research studies and census data from the American Community Survey. Additionally, our inclusive digital public services measure examines how states utilize technology to serve their communities during COVID-19, and factors in qualitative indicators such as the quality of COVID-19 data reporting between March and May, technology development as a priority to state officials, and municipal broadband roadblocks and restrictions. Please refer to the datasheet for a full breakdown of indicator inputs, sources, and weights.
With an unprecedented global pandemic prompting a marked reliance on digital services while workplaces, schools, and government offices remain closed, states who score higher on this axis are presumed to be better equipped to move to online channels during the crisis.
Change in Workplace, Residential, and Transit Mobility (Mar 16 – May 13)
The average change in workplace, residential, and transit mobility was calculated using Google COVID-19 Community Mobility Reports, which serves as a proxy for the extent to which citizens in the 50 states plus District of Columbia practice social distancing. We compiled each state’s average workplace, residential, and transit mobility change between March 16, 2020, and May 13, 2020, and weighted each measure: 0.4 for residential and workplace, and 0.2 for transit. We inversed the residential change (to account for its positive sign as more people were staying at home) and combined the three values.
A more significant decrease in the change in workplace, residential, and transit mobility shows higher compliance with stay-at-home orders (for most states which issued them) and/or a higher level of voluntary compliance by citizens.
Unemployment Insurance Claims
The cumulative number of unemployment insurance claims by state is pulled from the weekly report issued by the U.S. Department of Labor, and spans the weeks ending Mar 7, 2020, to May 23, 2020.
A larger bubble indicates a higher absolute number of unemployment insurance claims.
Out of Work
Out of Work measures the proportion of a state’s total labor force (as of February 2020) that has filed for unemployment insurance within the weeks ending Mar 7, 2020, to May 23, 2020. The cumulative number of unemployment insurance claims for each state during this period is taken from the U.S. Department of Labor and divided by the state’s total labor force from the U.S. Chamber of Commerce.
A greater out of work percentage reflects states hit hardest by closures and social distancing measures brought on by COVID-19.
All data and sources are available here.
Former Digital Planet Graduate Analysts Malavika Krishnan, Madhuri Mukherjee, and Devyani Singh worked on this analysis under the guidance of Bhaskar Chakravorti, Ravi Shankar Chaturvedi, Christina Filipovic, and Joy Zhang at Digital Planet, The Fletcher School, Tufts University.


