Home > Off the Charts > Pride and Prejudice
Pride and Prejudice
Affiliation with LGBTQ+ varies by profession and age groups. Women are more likely than men to profess their association in their professional online presence.
Summary
For Pride Month, Digital Planet investigates the degree to which the LGBTQ+ community finds solidarity among STEM fields. Analysis reveals the share of workers who express their identity as or affiliation with the LGBTQ+ community on their resumes is smaller among STEM graduates than college graduates overall. Women in STEM were twice as likely as men to profess an affiliation with the gay community on their resumes. Younger STEM candidates display a higher rate of LGBTQ+ affiliation than their older colleagues but still significantly trailed younger college graduates overall.
Key Observations and Insights
While the culture of discrimination and exclusion faced by women and minorities in the STEM fields has garnered increasing attention in recent years—as noted in our study last month—less researched are how differences in sexual orientation or gender identity harbor prejudice in STEM sectors. Still less understood is how LGBTQ+ identification intersects with gender and race to create distinct obstacles for different subgroups of this understudied community.
For Pride Month, Digital Planet investigates to what degree LGBTQ+ community finds solidarity among STEM fields.
With the help of the talent database of SeekOut, an AI-powered Talent 360 platform, we collated profiles of U.S. workers who used keywords such as LGBTQ, gay, lesbian, etc. in their online professional presence. This approach captures candidates who publicly list an affiliation with LGBTQ+ networking groups, sororities, fraternities, advocacy groups. While this approach does not capture every person identifying as LGBTQ+, it does provide insights as to who elects to publicly express LGBTQ+ affiliation in their online professional presence.
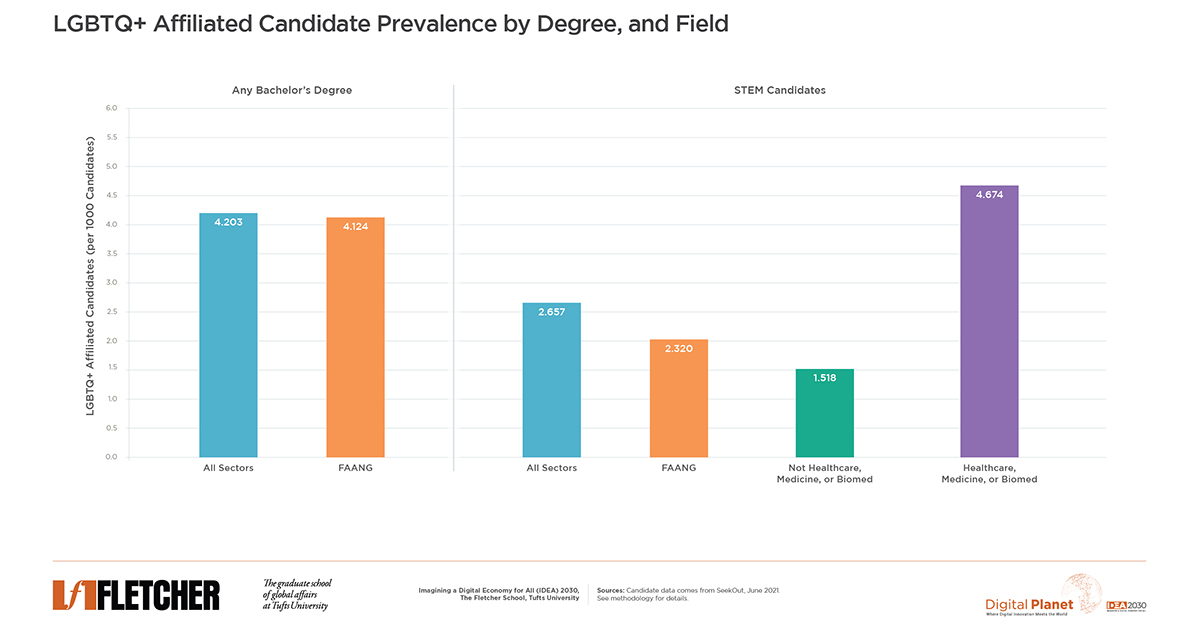
We found that the share of workers who expressed affiliation with the LGBTQ+ community on their resumes is smaller among STEM graduates than college graduates overall. While STEM graduates specializing in healthcare or pharmaceuticals were actually 11% more likely to affiliate with LGBTQ+ than those with at least a bachelor’s in any field, all other STEM graduates were only about a third as likely as college graduates overall to affiliate likewise.
Though our previous round of analysis using SeekOut’s talent database demonstrated the pronounced barriers to fair representation faced by women in STEM, this analysis suggests that it is men who are less likely than women to publicly affiliate with LGBTQ+ groups in their online professional presence.
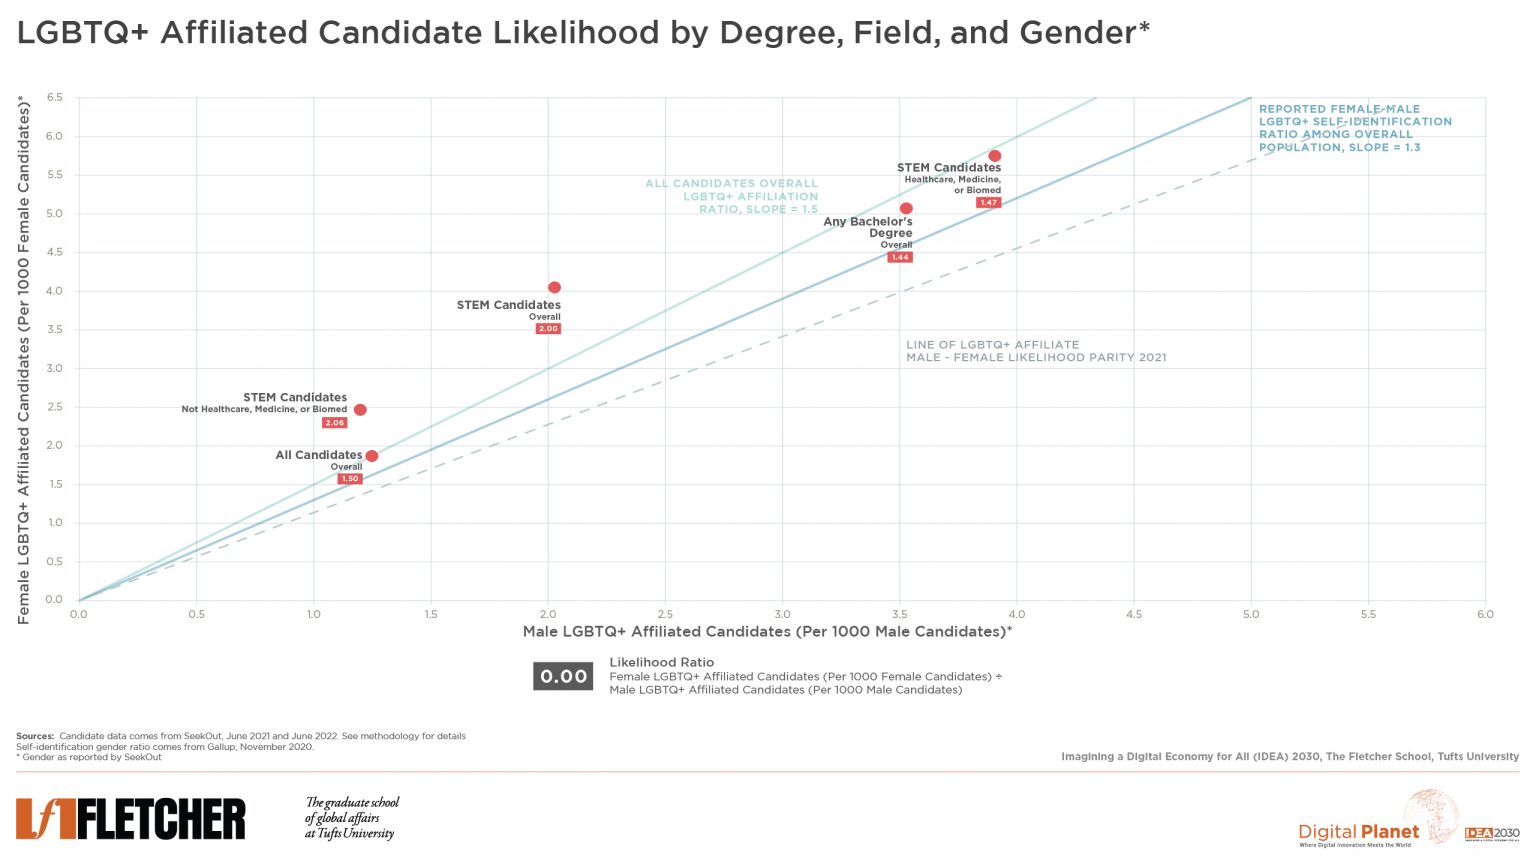
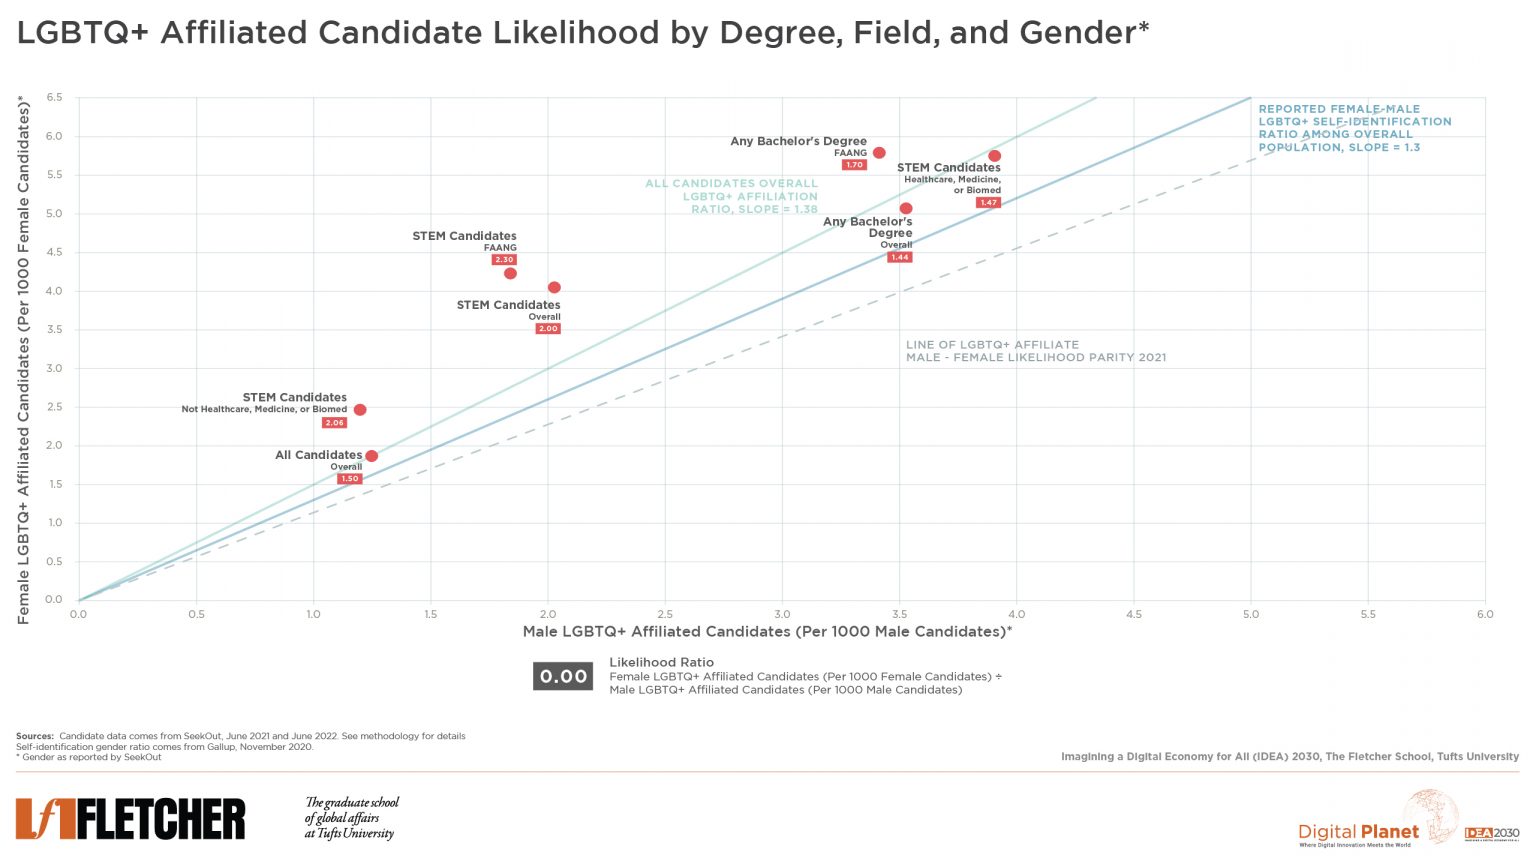
Women in STEM were twice as likely as men to express an affiliation with the gay community on their resumes. This figure indicates a far greater gender disparity of LGBTQ+ affiliation in STEM than would be expected given the sexual orientation makeup of overall population; a recent Gallup poll indicated women overall were just 1.3x as likely as men to identify as LGBTQ+. The gender ratio of data collected from SeekOut aligned closely with the Gallup poll, with women in the workforce overall being about 1.5x as likely as men to report an affiliation with LGBTQ+ on their resumes.
The relative rarity of STEM men reporting an affiliation with LGBTQ+ on their resumes is striking. Though men with a college degree in any field were nearly three times as likely as men overall to express an affiliation with the LGBTQ+ community, men with STEM degrees in fields unrelated to medicine or healthcare were 5% less likely than men overall to report the same.
The tech sector—one of the least diverse of all STEM fields —fared little better at facilitating open affiliation than the rest of non-healthcare STEM. Analysis of LGBTQ+ affiliation prevalence among FAANG (Facebook, Amazon, Apple, Netflix, and Google) employees offers a good approximation of how closely LGBTQ+ diversity in the tech sector aligns with STEM at large.
Both men and women with STEM degrees employed at FAANG companies recorded higher rates of LGBTQ+ affiliation on their resumes than the overall non-healthcare STEM workforce. Interestingly, STEM women employed at FAANG companies were 2.3x as likely as their male peers to report LGBTQ+ affiliation, the highest disparity of any analyzed subgroup.
That certain groups are more likely to profess LGBTQ+ affiliation may have several explanations. For one, college graduates likely had more opportunity to explore LGBTQ+ sororities, fraternities, advocacy organizations, and clubs while at university. Similarly, FAANG employees are perhaps likelier to join LGBTQ+ networking groups due to the sprawling size of their companies and the liberal-leaning locations where they are headquartered. Fields that skew younger may also present a higher rate of LGBTQ+ self-identification. Gallup found that younger generations identify as LGBTQ+ in greater numbers, with 15.9% of Gen Z self-identifying as LGBT versus only 2% of boomers.
Younger STEM candidates did display a higher rate of LGBTQ+ affiliation than their older colleagues but still significantly trailed younger college graduates overall.
While much progress has been made on several fronts, prejudices persist, especially in STEM talent pipelines. Two Vanderbilt economists found that fewer LGBTQ+ students, particularly gay men, pursue degrees in STEM than their straight and cisgender peers due to inherent biases in education. Workplace culture within STEM may also be a factor. A study of federal workers corroborated that LGBTQ+ employees in STEM-related agencies suffered more negative workplace experiences than those in non-STEM public sector employment. Another survey of STEM workers found that LGBTQ+ employees were nearly twice as likely as their straight and cisgender peers to experience bullying or public humiliation at work.
Why men in STEM seem less likely to profess affiliation with LGBTQ+ on their resumes remains under-researched. Possible explanations include a greater fear of discrimination among gay men in some STEM sectors due to their well-documented “Bro” culture. In an industry where simply being a man offers insider advantages, many may find it easier to “go along to get along” rather than express their out-ness and risk being cast out.
Conversely, STEM women may be more likely to lean into their LGBTQ+ identity in the workplace to find community and solidarity with fellow LGBTQ colleagues in an otherwise exclusionary environment.
What’s clear is that industry leaders and STEM professionals must do more to foster safe and accepting environments for members of the LGBTQ+ community in their organizations. NYU’s Jon Freeman avers that improving inclusion for sexual-minorities in STEM begins with collecting better data on the state of sexual diversity, and has pushed for the NSF to start tracking sexual orientation and gender identity in its national STEM census. He has also encouraged increasing visibility for LGBTQ+ in STEM with networking events and advocacy organizations. Erin Cech at the University of Michigan concluded her study on the impact of discrimination for LGBTQ+ people in STEM with a recommendation for firms to establish LGBTQ+ employee resource groups, which work to ensure equal access to “formal and informal benefits” in the workplace.
Interestingly, research has shown that fields with higher percentages of women also reported greater LGBTQ+ openness; closing the gender gap in STEM may also help to lift LGBTQ+ representation. Perhaps most importantly, STEM executives have a responsibility to audit hiring and compensation practices for anti-LGBTQ+ bias.
Overcoming the barriers to LGBTQ+ representation in the STEM fields covered in this analysis will require concerted efforts by industry leaders and community advocates. Doing so will foster a healthier, kinder, and more inclusive work environment for all.
Research Methodology
Data was collected using the SeekOut proprietary database. SeekOut, an AI-powered platform for recruiting, uses algorithms to “scrape” publicly available resumes from all over the web. Candidates are not necessarily looking for work, and are most often currently employed. All candidates in this study were US-based.
LGBTQ+ affiliated profiles were collated by filtering returned samples for the keywords “LGBT”, “LGBTQ”, “LGBTQ+”, “Gay”, “Lesbian”, “Queer”, or “Bisexual.” The keyword “Trans” was not included in the search due to a higher rate of erroneous sample returns when included. This methodology only seeks to assess the degree to which candidates are publicly affiliating with LGBTQ+ on their resumes. Inclusion of these keywords on candidate resumes is not a direct indicator of a candidate’s sexual orientation or gender identity, and thus this methodology in no way portends to measure directly the prevalence of self-identified LGBTQ+ people in any given field.
Reported candidate genders are generated by SeekOut’s profile assessments, and may or may not reflect the self-identified gender of candidates returned in our sample. SeekOut provides no filter for gender non-conforming or non-binary candidates.
STEM graduates, according to SeekOut, include those people “with a degree in a science, technology, engineering, or math field.”
SeekOut-provided filters were used to select candidates with a bachelor’s degree or higher in any field. Similarly, SeekOut’s filter for “current employer” was used to find candidates currently employed at Facebook, Apple, Amazon, Netflix, and Google.
Candidates employed in the healthcare, medicine, or biomed sectors were collated by applying a keyword filter for “medical”, “biomed”, “health”, “healthcare”, or “pharma.”
Likelihood ratios between male and female candidates as reported by SeekOut were calculated by dividing LGBTQ+ affiliated women (per 1000 female candidates) by LGBTQ+ affiliated men (per 1000 male candidates). Likelihood ratios can be interpreted as the percentage difference in likelihood divided by 100 (i.e. a ratio of 1.5 should be interpreted as 1.5 times as likely).
Digital Planet Analyst Griffin Brewer worked on this analysis under the guidance of Bhaskar Chakravorti, Ravi Shankar Chaturvedi, Christina Filipovic, and Joy Zhang at Digital Planet, The Fletcher School, Tufts University.
This research is a part of the IDEA 2030 initiative, made possible by the generous support from the Mastercard Center for Inclusive Growth
