
Home > Off the Charts > How Green is the Greenback? An Analysis of the Environmental Costs of Cash in the United States
How Green is the Greenback? An Analysis of the Environmental Costs of Cash in the United States
All methods of storing value have some environmental cost associated with them. We explore the environmental costs of US cash notes, which amount to $0.26 annually per note, based on resources used and CO2 released. We then compare our cash estimate to the environmental costs of crypto assets, using Bitcoin as the basis, and totals $70 annually per coin in terms of CO2 released. However, when considering all the US banknotes in circulation in the aggregate, and all the mined Bitcoin currently available, we find that the overall environmental impact of cash notes ($12.9 billion USD) far exceeds the environmental cost of Bitcoin ($1.3 billion USD).
In 2020, the US printed more than five billion new cash notes. Though global cash transactions may be in decline, US production of cash notes has remained relatively flat. As cash production requires raw materials, some of them scarce, in this analysis we examine the questions: how green is the greenback, i.e., what is the environmental cost of producing and using cash notes? And how does this cost compare to that of crypto assets, like Bitcoin?
The Environmental Impact of Cash
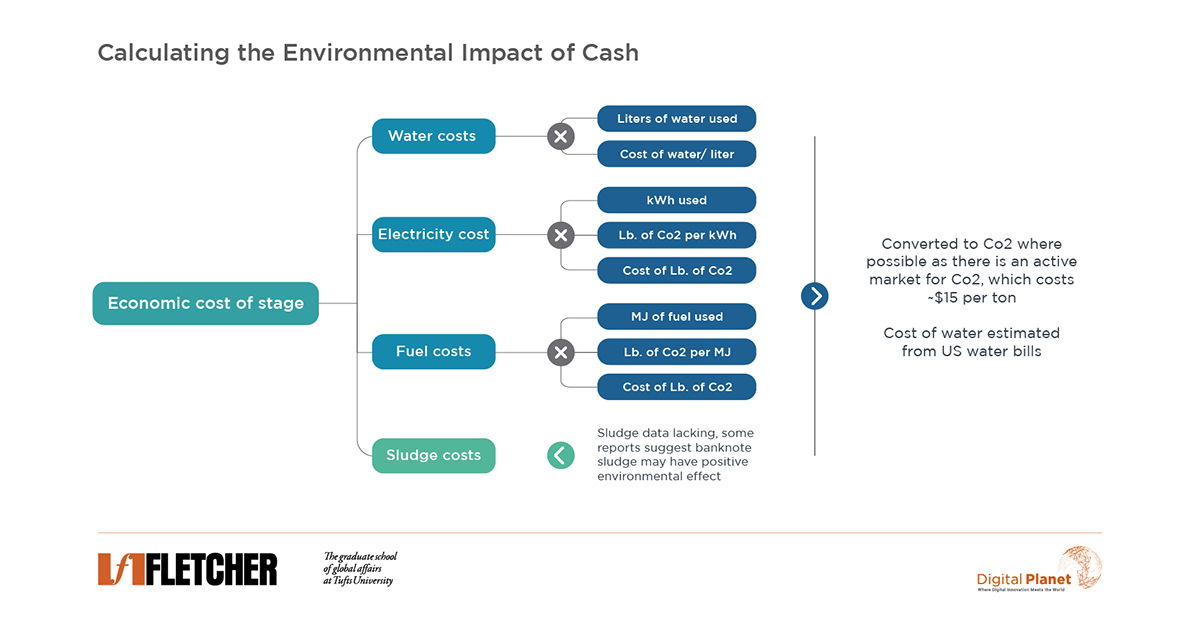
Producing cash, including coins, requires water, energy, and fuel. Each of these inputs has its own price or can be translated into the cost of CO2 it produces. In addition, cotton is the main ingredient in a US cash note, and we know the megajoules (MJ) of fuel required to harvest a gram of cotton. Through converting those MJ to CO2 released per MJ, and then multiplying this by the cost of a pound of CO2 in the carbon market, we can estimate the fuel costs to the environment for producing cash notes. As the exhibit below illustrates, through additional analysis of the water, electricity, and sludge costs, we arrive at a final estimate of the costs to the environment from cash note production.

Taking a lifecycle view to calculating the cost of cash to the environment is helpful in understanding the negative externalities of cash production and usage on the environment. The lifecycle for currency can be broken into three main stages (production, operation, and end of life) with sub-stages within each stage. Every stage has its own cost drivers. For example, material inputs and transportation drive production costs; while distance to retrieve or deposit cash, frequency of deposits or retrieval, and ATM costs drive operational costs. End-of-life costs are driven by transportation and energy use but are minimal or even negative due to recycling.
Using the aforementioned methods and stages, our analysis identified the total cost of producing a US cash note to the environment as $2.20. The operation stage of using a cash note contributes most of these costs at $2.17, while production contributes ~$0.03—using input prices and the cost of CO2 produced to calculate comparable units.

Benchmarking these findings against the 2018 Nederlandsche Bank report, “Lifecycle assessment of cash payments,” suggests our $2.20 estimate for US bill costs is on par with other analyses on the lifecycle and cost of cash. For example, the report calculates Euro note production costs, which one can use to calculate the environmental production costs for a single note. Factoring in a small multiplier to adjust for the difference in materials (i.e., Euros use a polymer cotton mix, which reduces their environmental costs whereas the US Dollar bill uses cotton), our analysis extrapolated US note production costs to be $0.029. Though nearly 20% different from our bottom-up calculation of $0.036 per note, the numbers are in the same order of magnitude.
Knowing a US banknote costs $2.20 to the environment is more useful when compared with the environmental footprint of other stores of value. Crypto assets such as Bitcoin make for a relevant comparison given (1) it’s increasing appeal among investors and a push to make them a viable medium of exchange (they are not currently a widespread medium of exchange) (2) the heavy scrutiny in the recent past of its environmental impact.
The Environmental Impact of Crypto Assets
Publicly available Bitcoin data allows for an estimation of a Bitcoin’s total annual environmental cost. Bitcoin reportedly uses 120 terawatt-hours (TWh) of energy annually — more energy than the Netherlands consumes annually, and around half that of the United Kingdom. Breaking this down across the 19 million Bitcoin in existence suggests that each consumes 6,300 kilowatt-hours (kWh) of electricity annually. For reference, this figure—the annual energy consumption from a single Bitcoin—could power the average US home for more than 200 days. Furthermore, while this analysis looks at Bitcoin alone, a recent study in the energy research journal Joule found that under-studied cryptocurrencies add nearly 50% more energy consumption beyond Bitcoin’s current significant impact.
According to our analysis, per Bitcoin, mining (i.e., production) and transactions are estimated to cost $70 in CO2 released annually. Analyzing Bitcoin by its lifecycle, similar to the framework we used with cash, provides an estimate one can translate into environmental costs using CO2 produced per kWh and the market price per pound of CO2. Additionally, the process produces massive amounts of e-waste or hardware thrown into the ocean or landfills.
Bitcoin mining consumes the most energy, roughly 51,000 kWh per Bitcoin, or $352 of CO2.
Considering the average Bitcoin has existed for ~8 years, this implies a CO2 cost to the environment of $43 per year per coin from mining.
Bitcoin transactions consume much less energy than mining, contributing less to environmental cost. The average Bitcoin is transacted 5.5 times per year. As each transaction uses 700 kW, on average, a Bitcoin’s annual transactions equate to $27.10 of CO2 produced annually.
Comparing the annual environmental costs of US banknotes and Bitcoin is an opportunity for further research. The average US banknote produces $0.26 worth of CO2 annually, as a banknote has an average lifetime of 8.6 years – quite different from the $70 cost per Bitcoin per year. Multiplying the annual environmental cost of a banknote by the 50 billion US banknotes in circulation implies an annual total environmental cost of $12.9 billion. This is high compared to Bitcoin, each costing the environment $70 per year multiplied by the nearly 19 million bitcoin mined to date results in a $1.3 billion environmental cost, suggesting banknotes may not be the lesser environmental evil after all.
As policymakers globally increase the scrutiny of the energy use of crypto assets, there is talk of a shift to less energy-intensive models. Crypto enthusiasts, undeterred, argue that “Bitcoin is key to an abundant, clean energy future.” The UN is examining how to prevent crypto assets from causing the world to backslide on climate goals, and is supporting the “Crypto Climate Accord,” which aims to decarbonize crypto and blockchain technologies.

While no method of storing value is devoid of environmental costs, a deeper understanding and a detailed lifecycle accounting of the environmental impact of crypto assets, cash, and other methods of payment and storage of value would help businesses and policymakers seek out more sustainable approaches, and work towards reducing the environmental footprint of money.
Methodology
This analysis compares the environmental cost of producing and using cash to that of mining and transacting Bitcoin. The study does not examine the hardware and materials waste that both currencies produce.
This analysis focuses on the environmental costs of paper money and excludes that of coins. We considered input costs to produce, transport, and refine cotton and printing and distribution costs once cotton is processed into paper money. We organized costs into major buckets of resources used, such as water, electricity, and fuel. These resources were priced at market rates or translated into Co2 produced per unit consumed and assumed a price of $15 per ton of Co2 emitted, which matches current carbon market estimates.
Sources for cost estimate inputs for both Bitcoin and cash are available here.
Graduate Student Analysts Ming Dongfang and Eric Flood worked on this analysis under the guidance of Ravi Shankar Chaturvedi, Christina Filipovic, and Joy Zhang at Digital Planet, The Fletcher School, Tufts University.
This research is a part of the IDEA 2030 initiative, made possible by the generous support from the Mastercard Center for Inclusive Growth


