Updated October 31, 2022
Summary
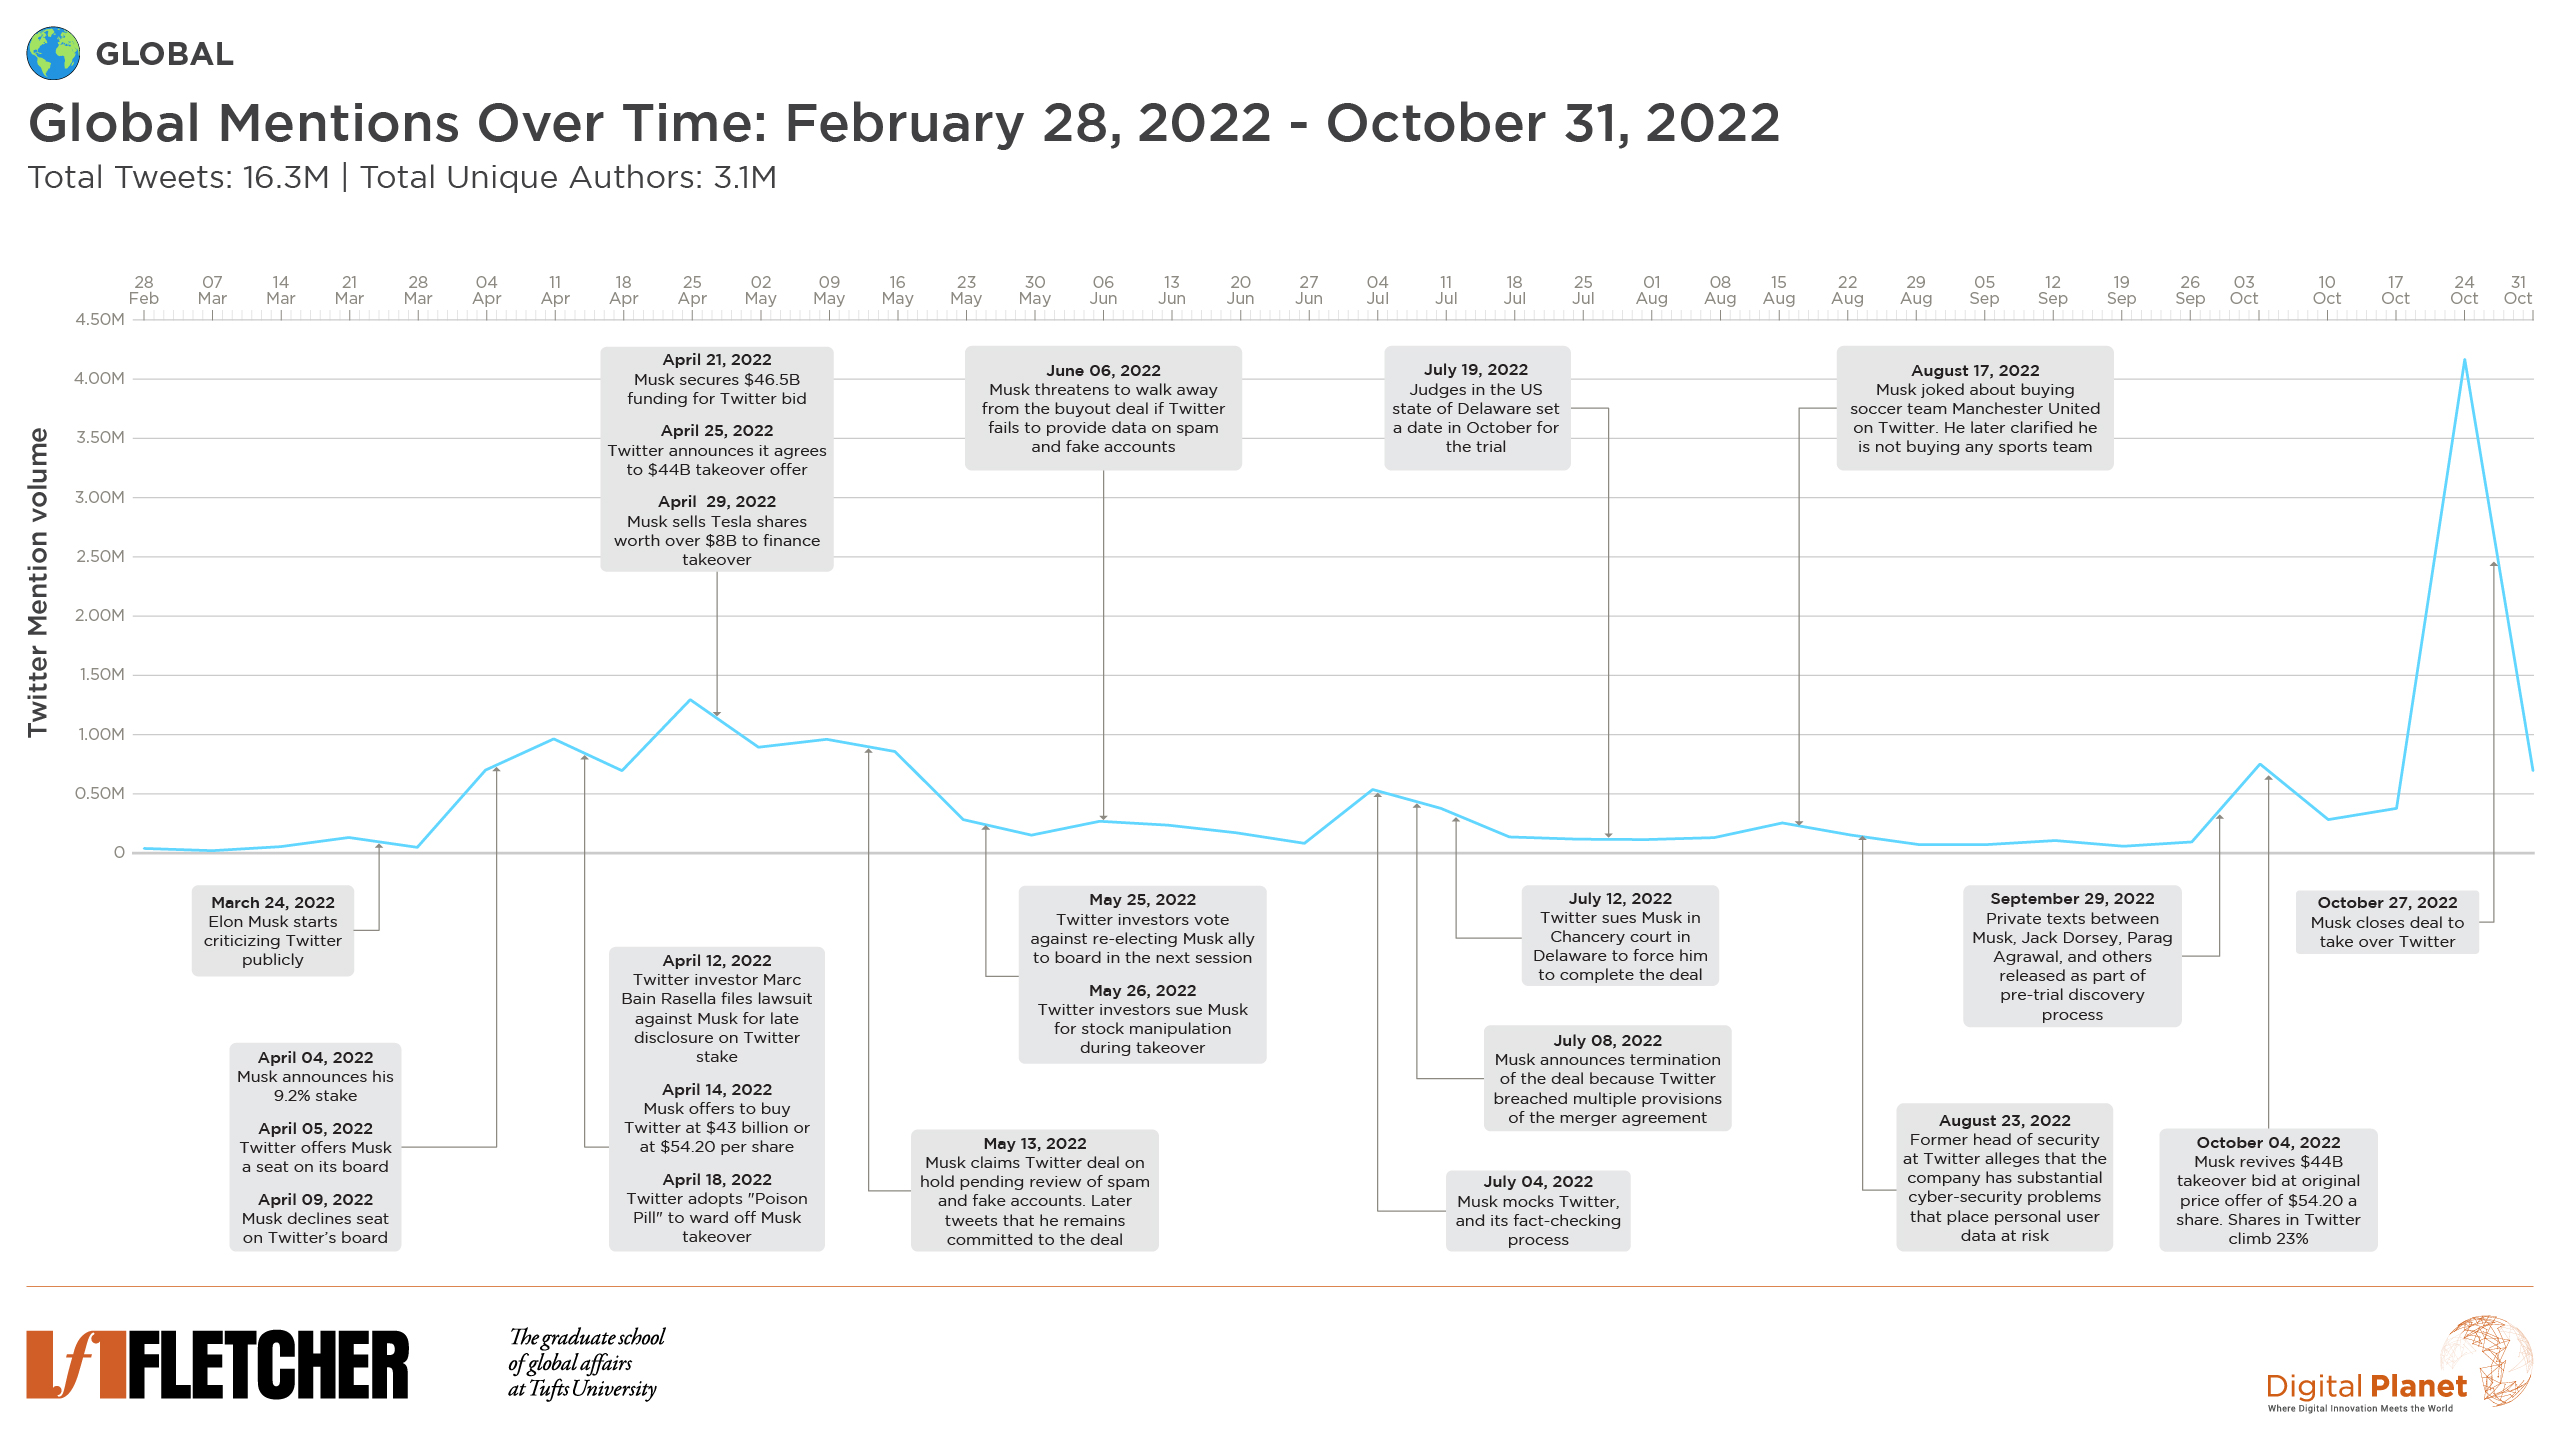
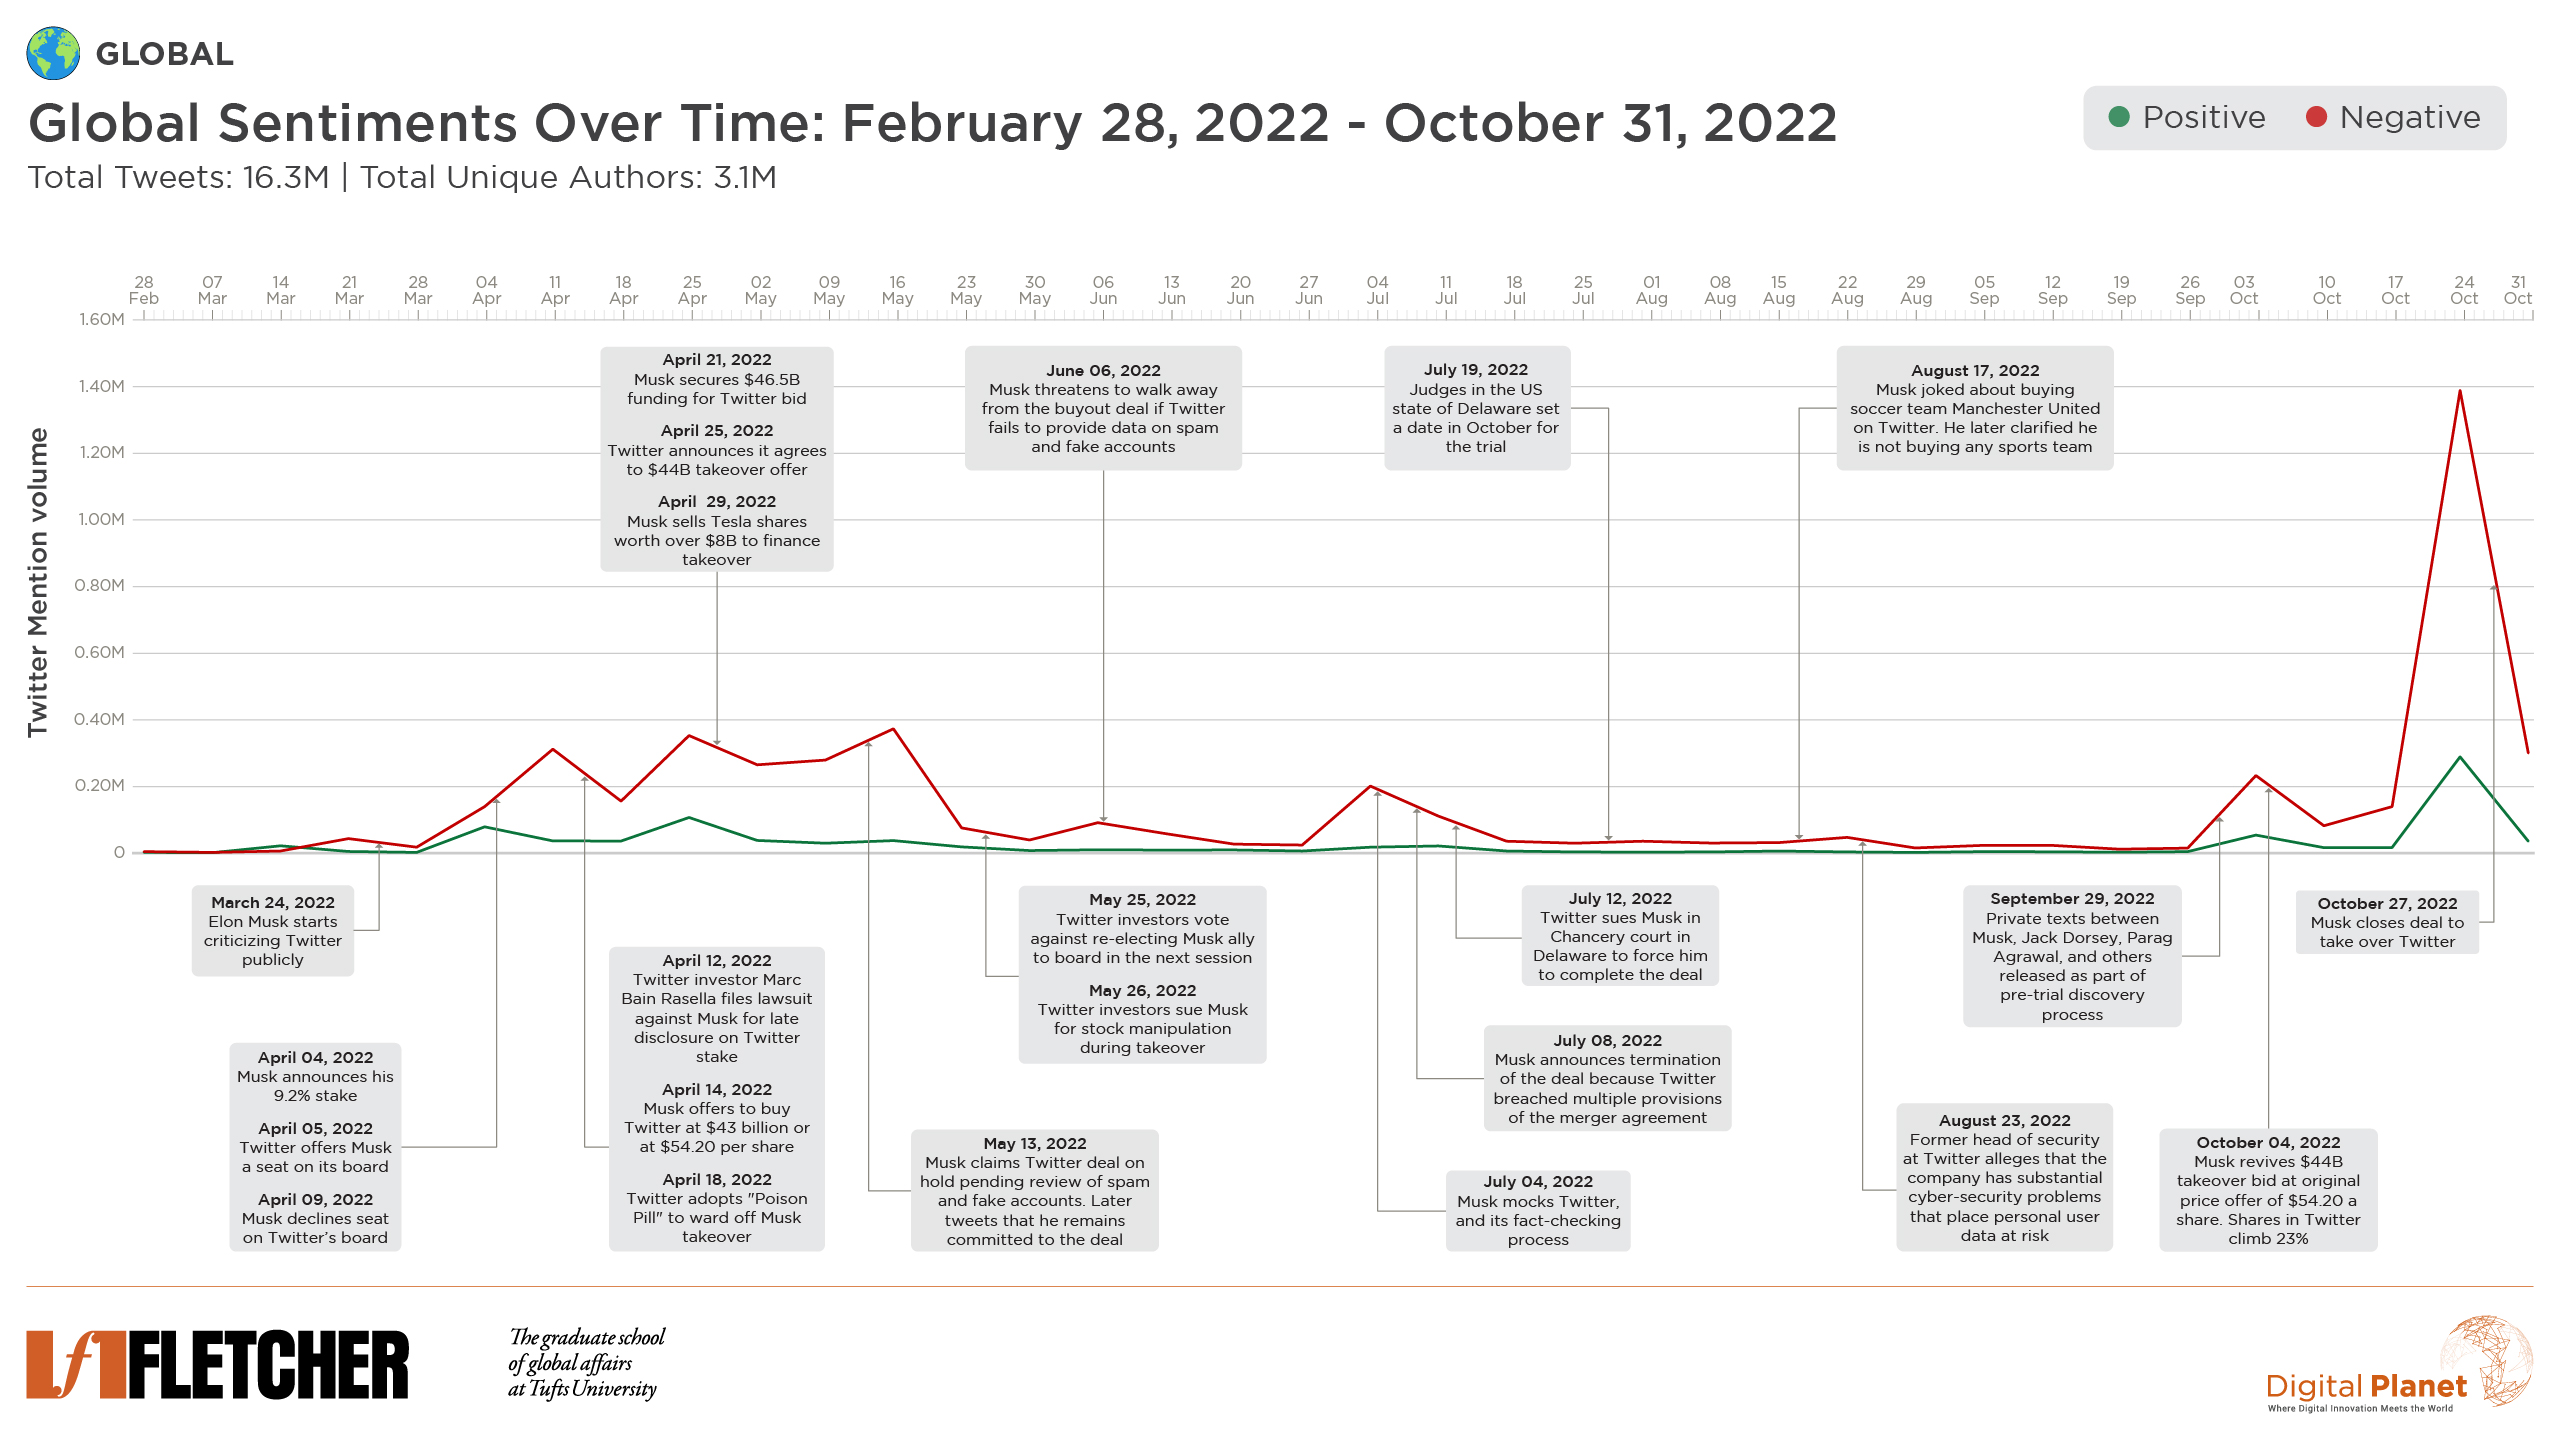
In our analysis of over 16.3 million tweets during an 8-month period (February 28th – October 31st, 2022) across 5 countries— the United States, United Kingdom, India, South Africa, and Nigeria— we studied the sentiments expressed by users on the platform to Elon Musk’s Twitter takeover saga. While reactions to Musk’s initial criticism of the platform were generally more positive, his plan to buy Twitter was met with largely negative emotions. This trend continued through his announcement reviving his initial bid to buy Twitter for the initial price of $54.20 per share. Sadness dominated the day across all countries studied when Musk took final control on October 27th.
Methodology Note: Tweet volume and sentiment are averaged by week, starting with the beginning of the week. For example, the October 24th spike seen in the chart includes all tweets from October 24th-October 30th. Read the full methodology at the end of the post.
On April 25th, Elon Musk, the richest man on earth, bought Twitter for $44 billion. One month before, in late March, Musk began publicly criticizing Twitter, saying he was toying with the idea of starting his own social media company, tweeting a poll asking if the Twitter algorithm should be made open source (82.7% of respondents said yes), and polling users on whether they believed Twitter adheres to free speech (70.4% said no). From there, a wild ride followed: Musk announced a 9.2% stake in the company; Twitter offered him a board seat; Musk offered to buy the company; the board’s “poison pill” defense failed; and finally Twitter and Musk agreed to a takeover deal. By early June however, Musk threatened to walk away from the deal. Within a month, he claimed he was terminating the deal, and Twitter responded by suing Musk.
Back in the Spring, the global reaction was mixed at first, with some negative and largely positive emotions emerging while Musk embarked on a public criticism of the company, but reactions turned more polarized when he announced his 9.2% stake. His offer to buy the company and the announcement that it went through were met with decidedly negative emotions. Similar emotions were again reflected when Elon Musk announced the revival of his initial takeover bid of $44 billion. While the overall sentiment remained highly negative, the overall engagement in the news of the revival was around 60% of the level seen in the first announcement for the bid to buy Twitter. When the takeover was finalized in late October, chatter on the platform eclipsed past peaks by over 3 times past volume.
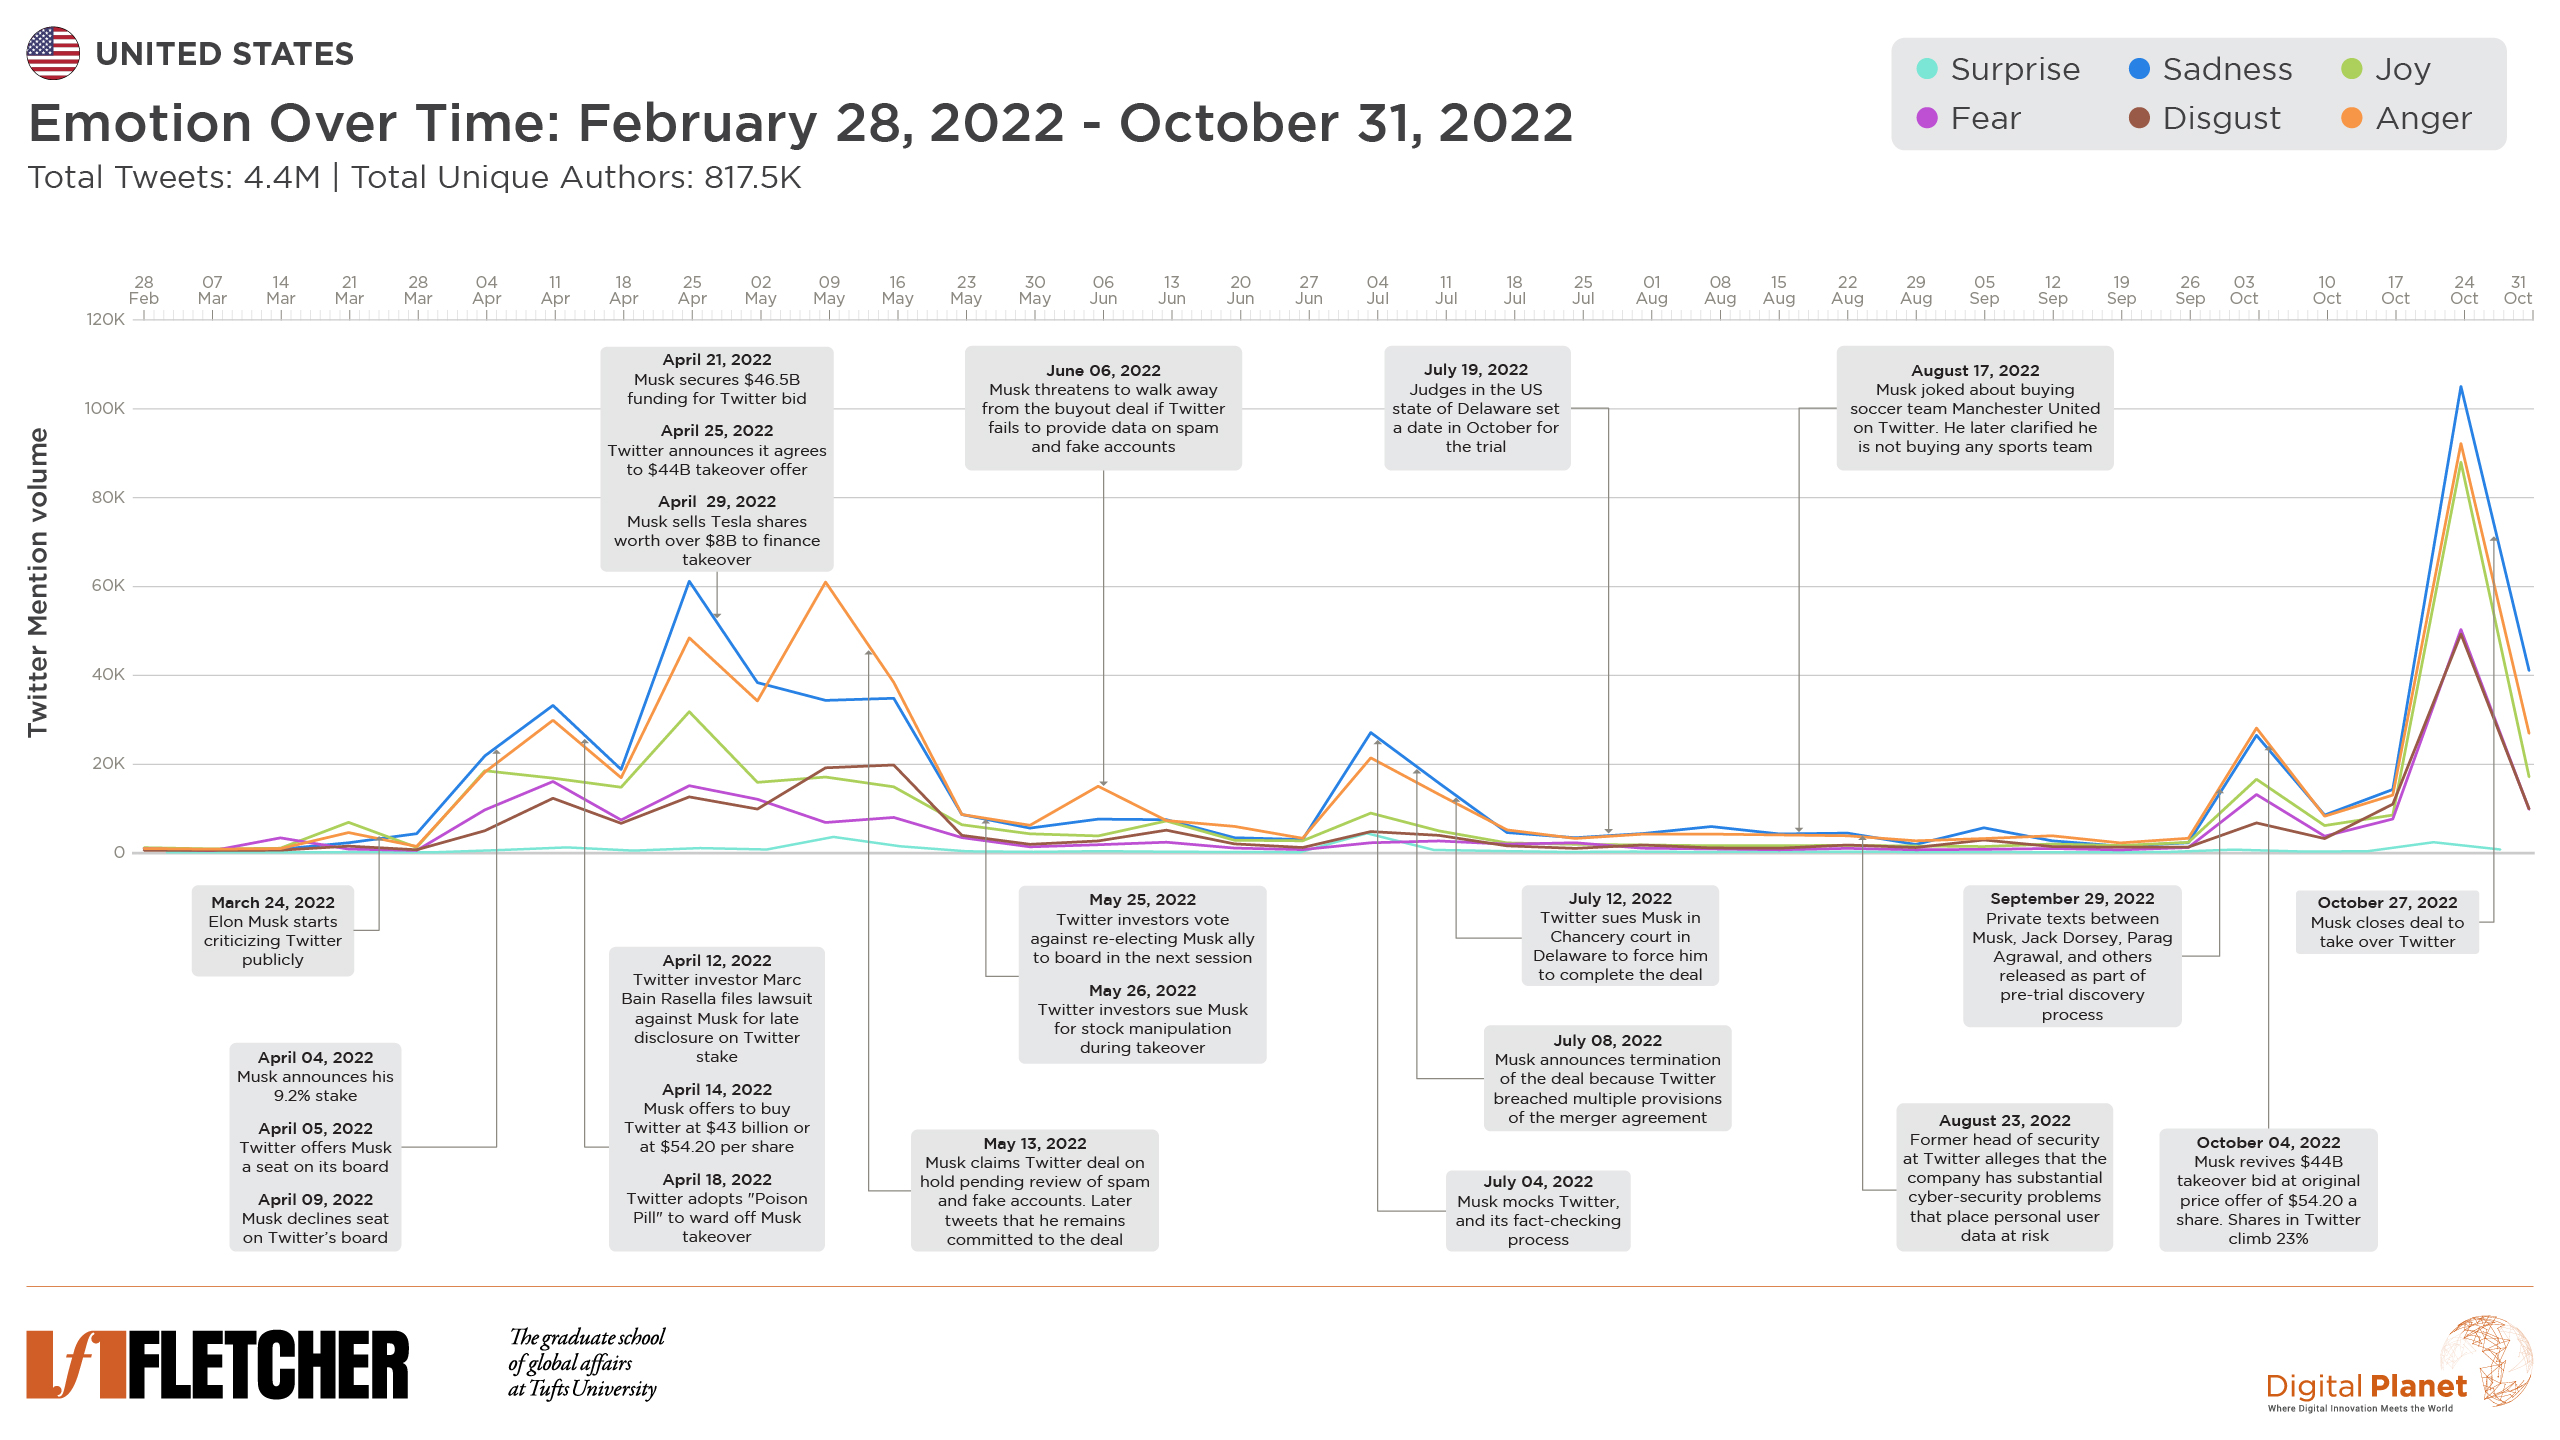
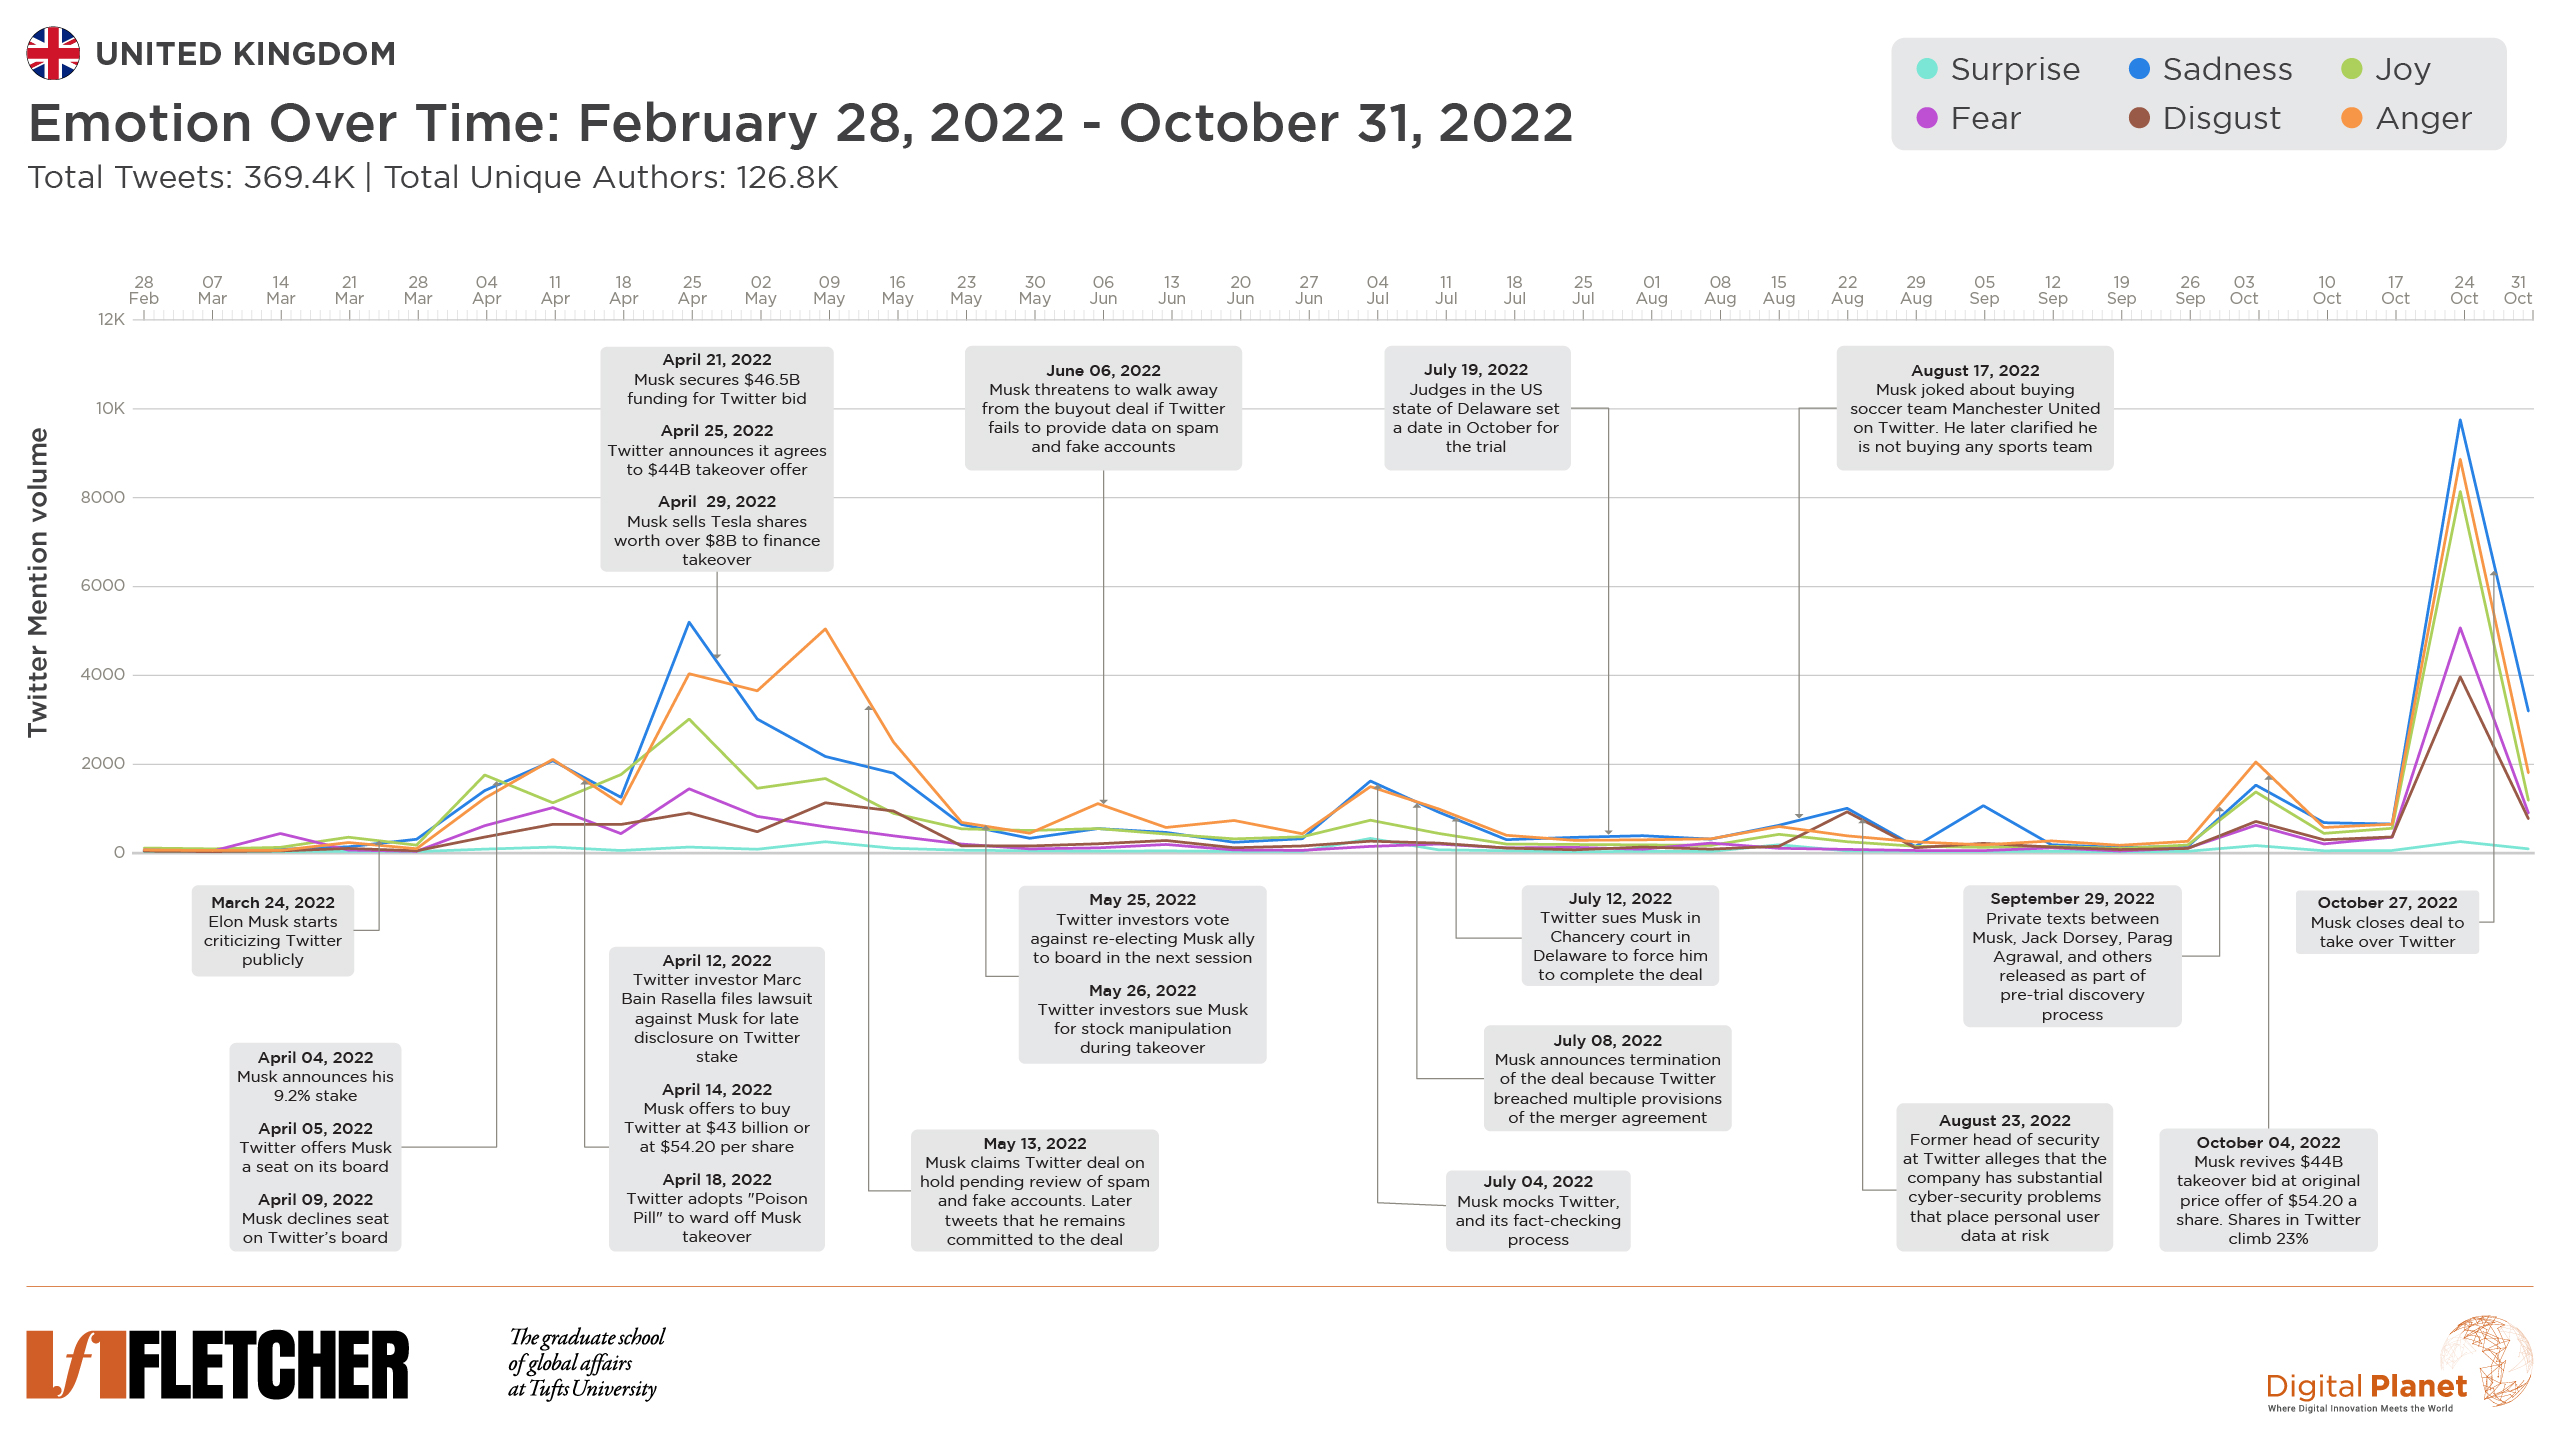
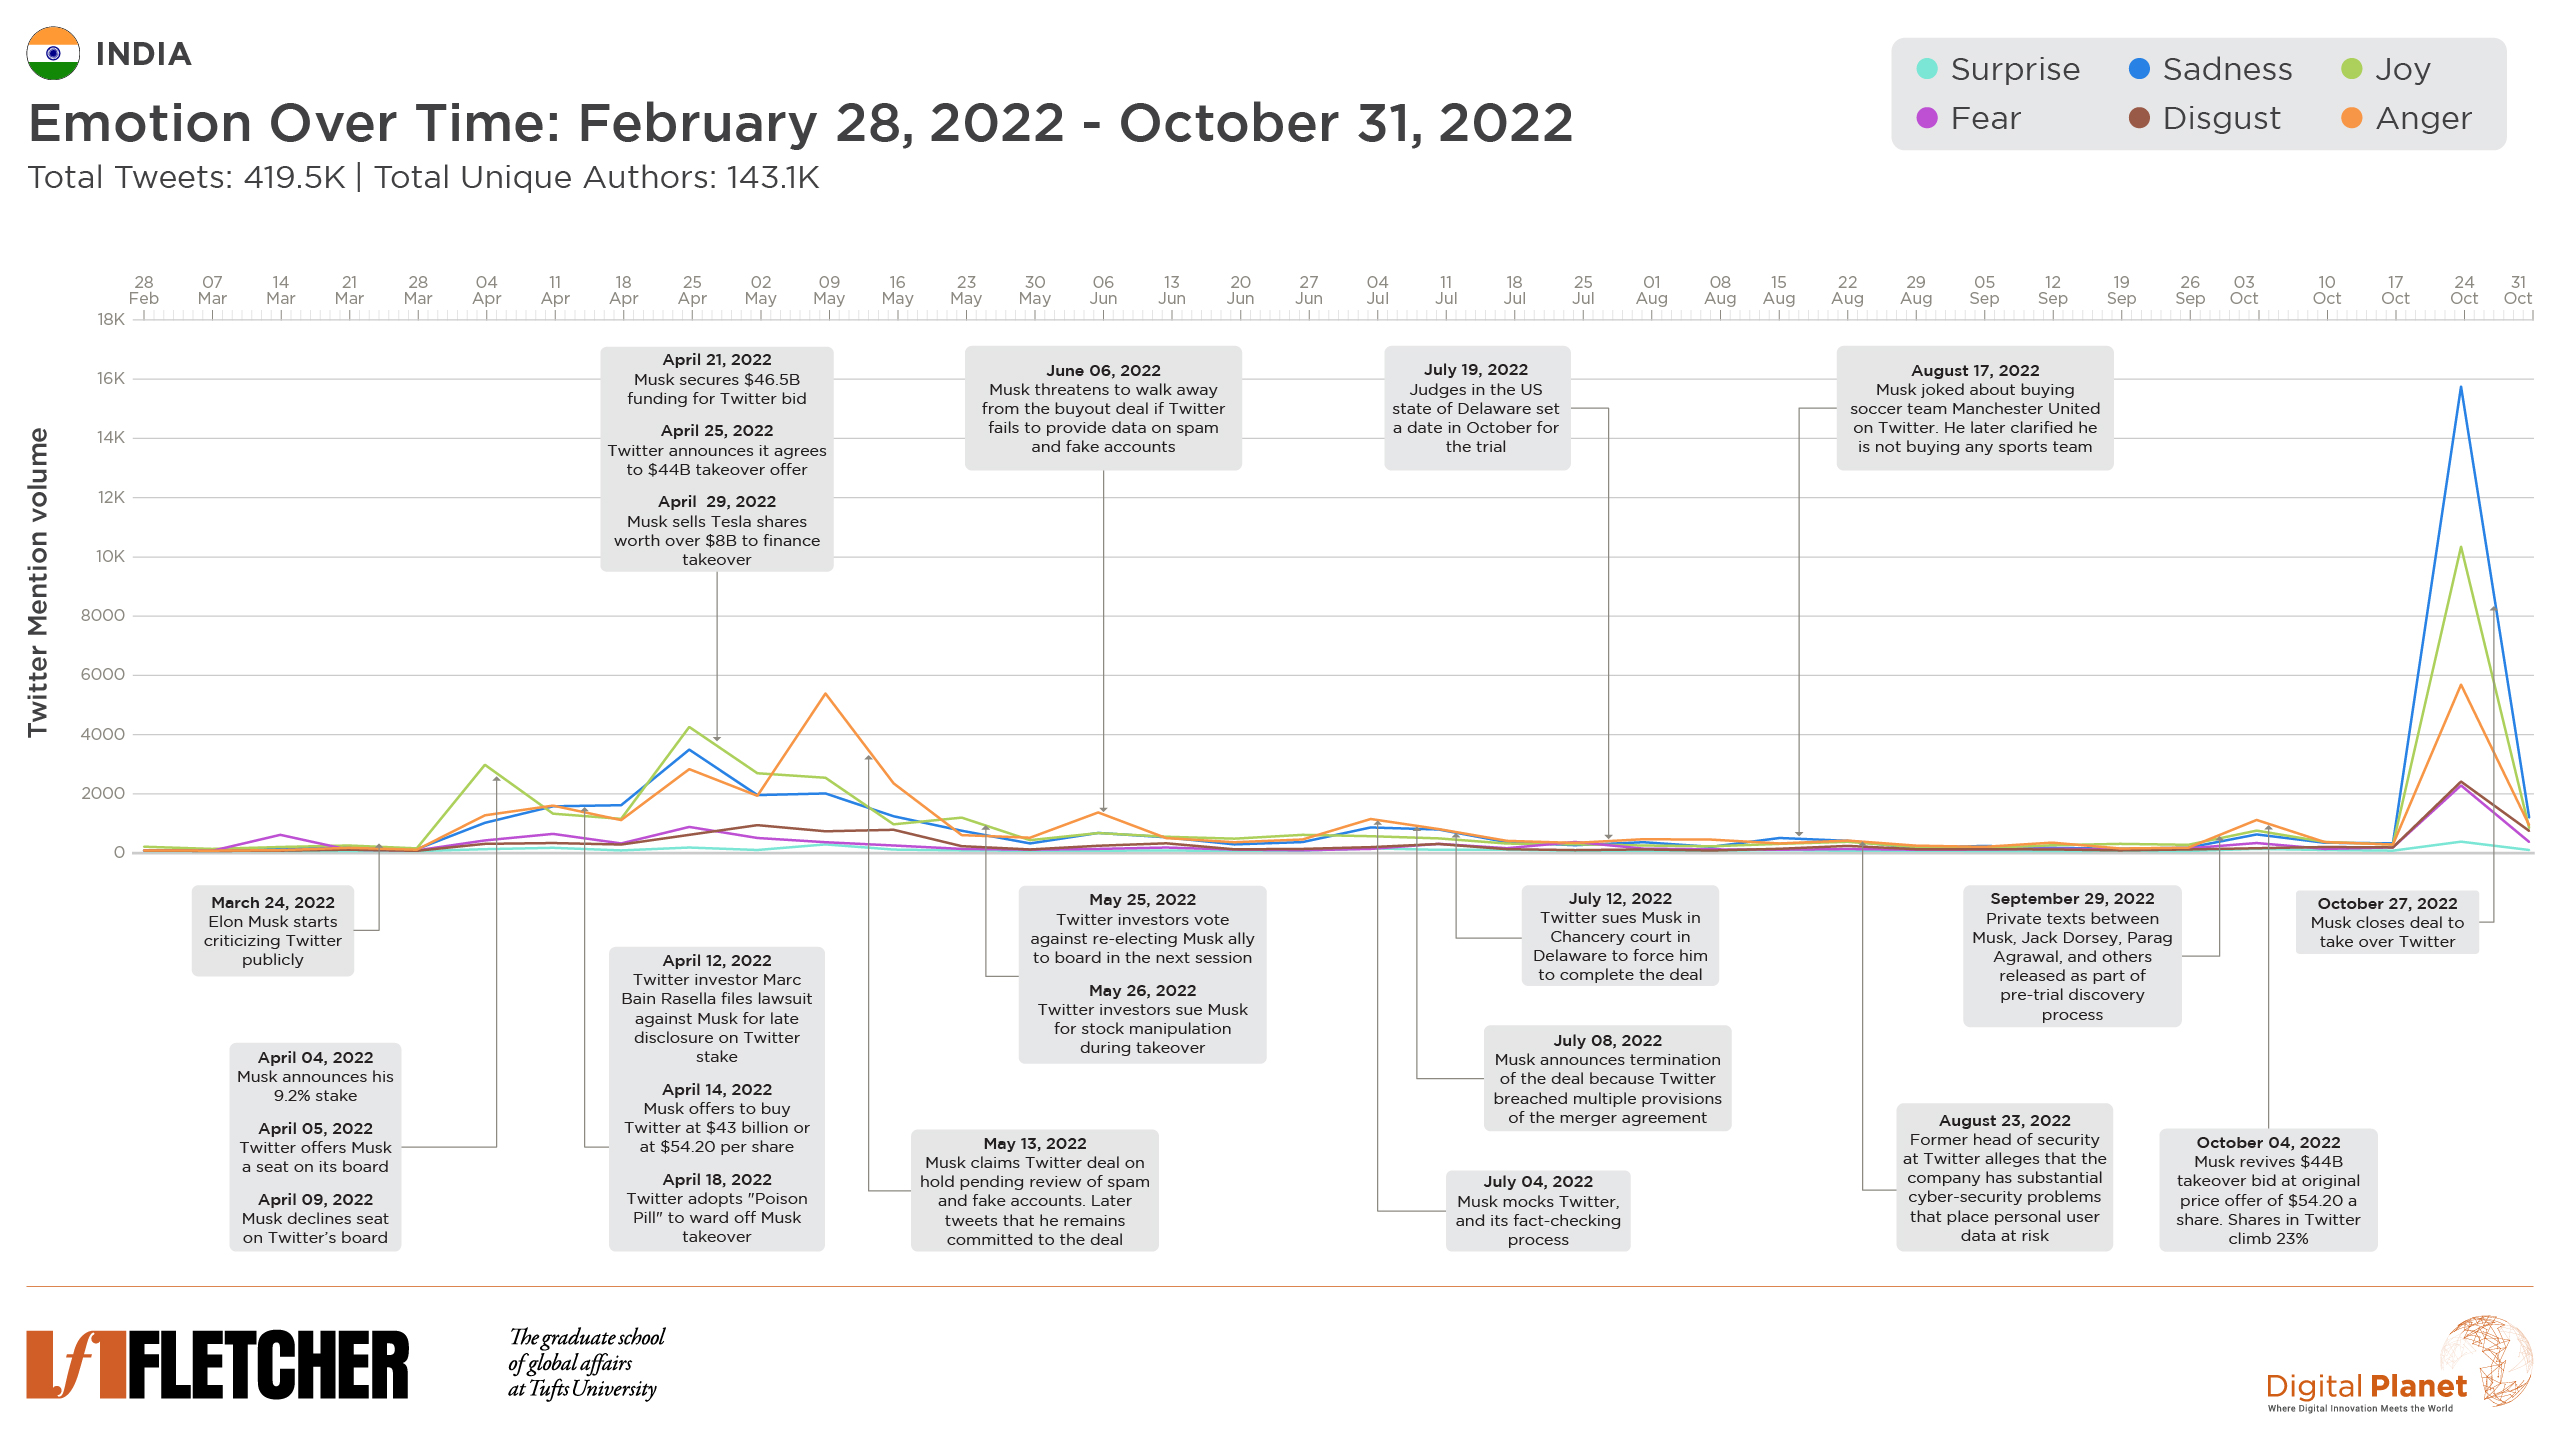
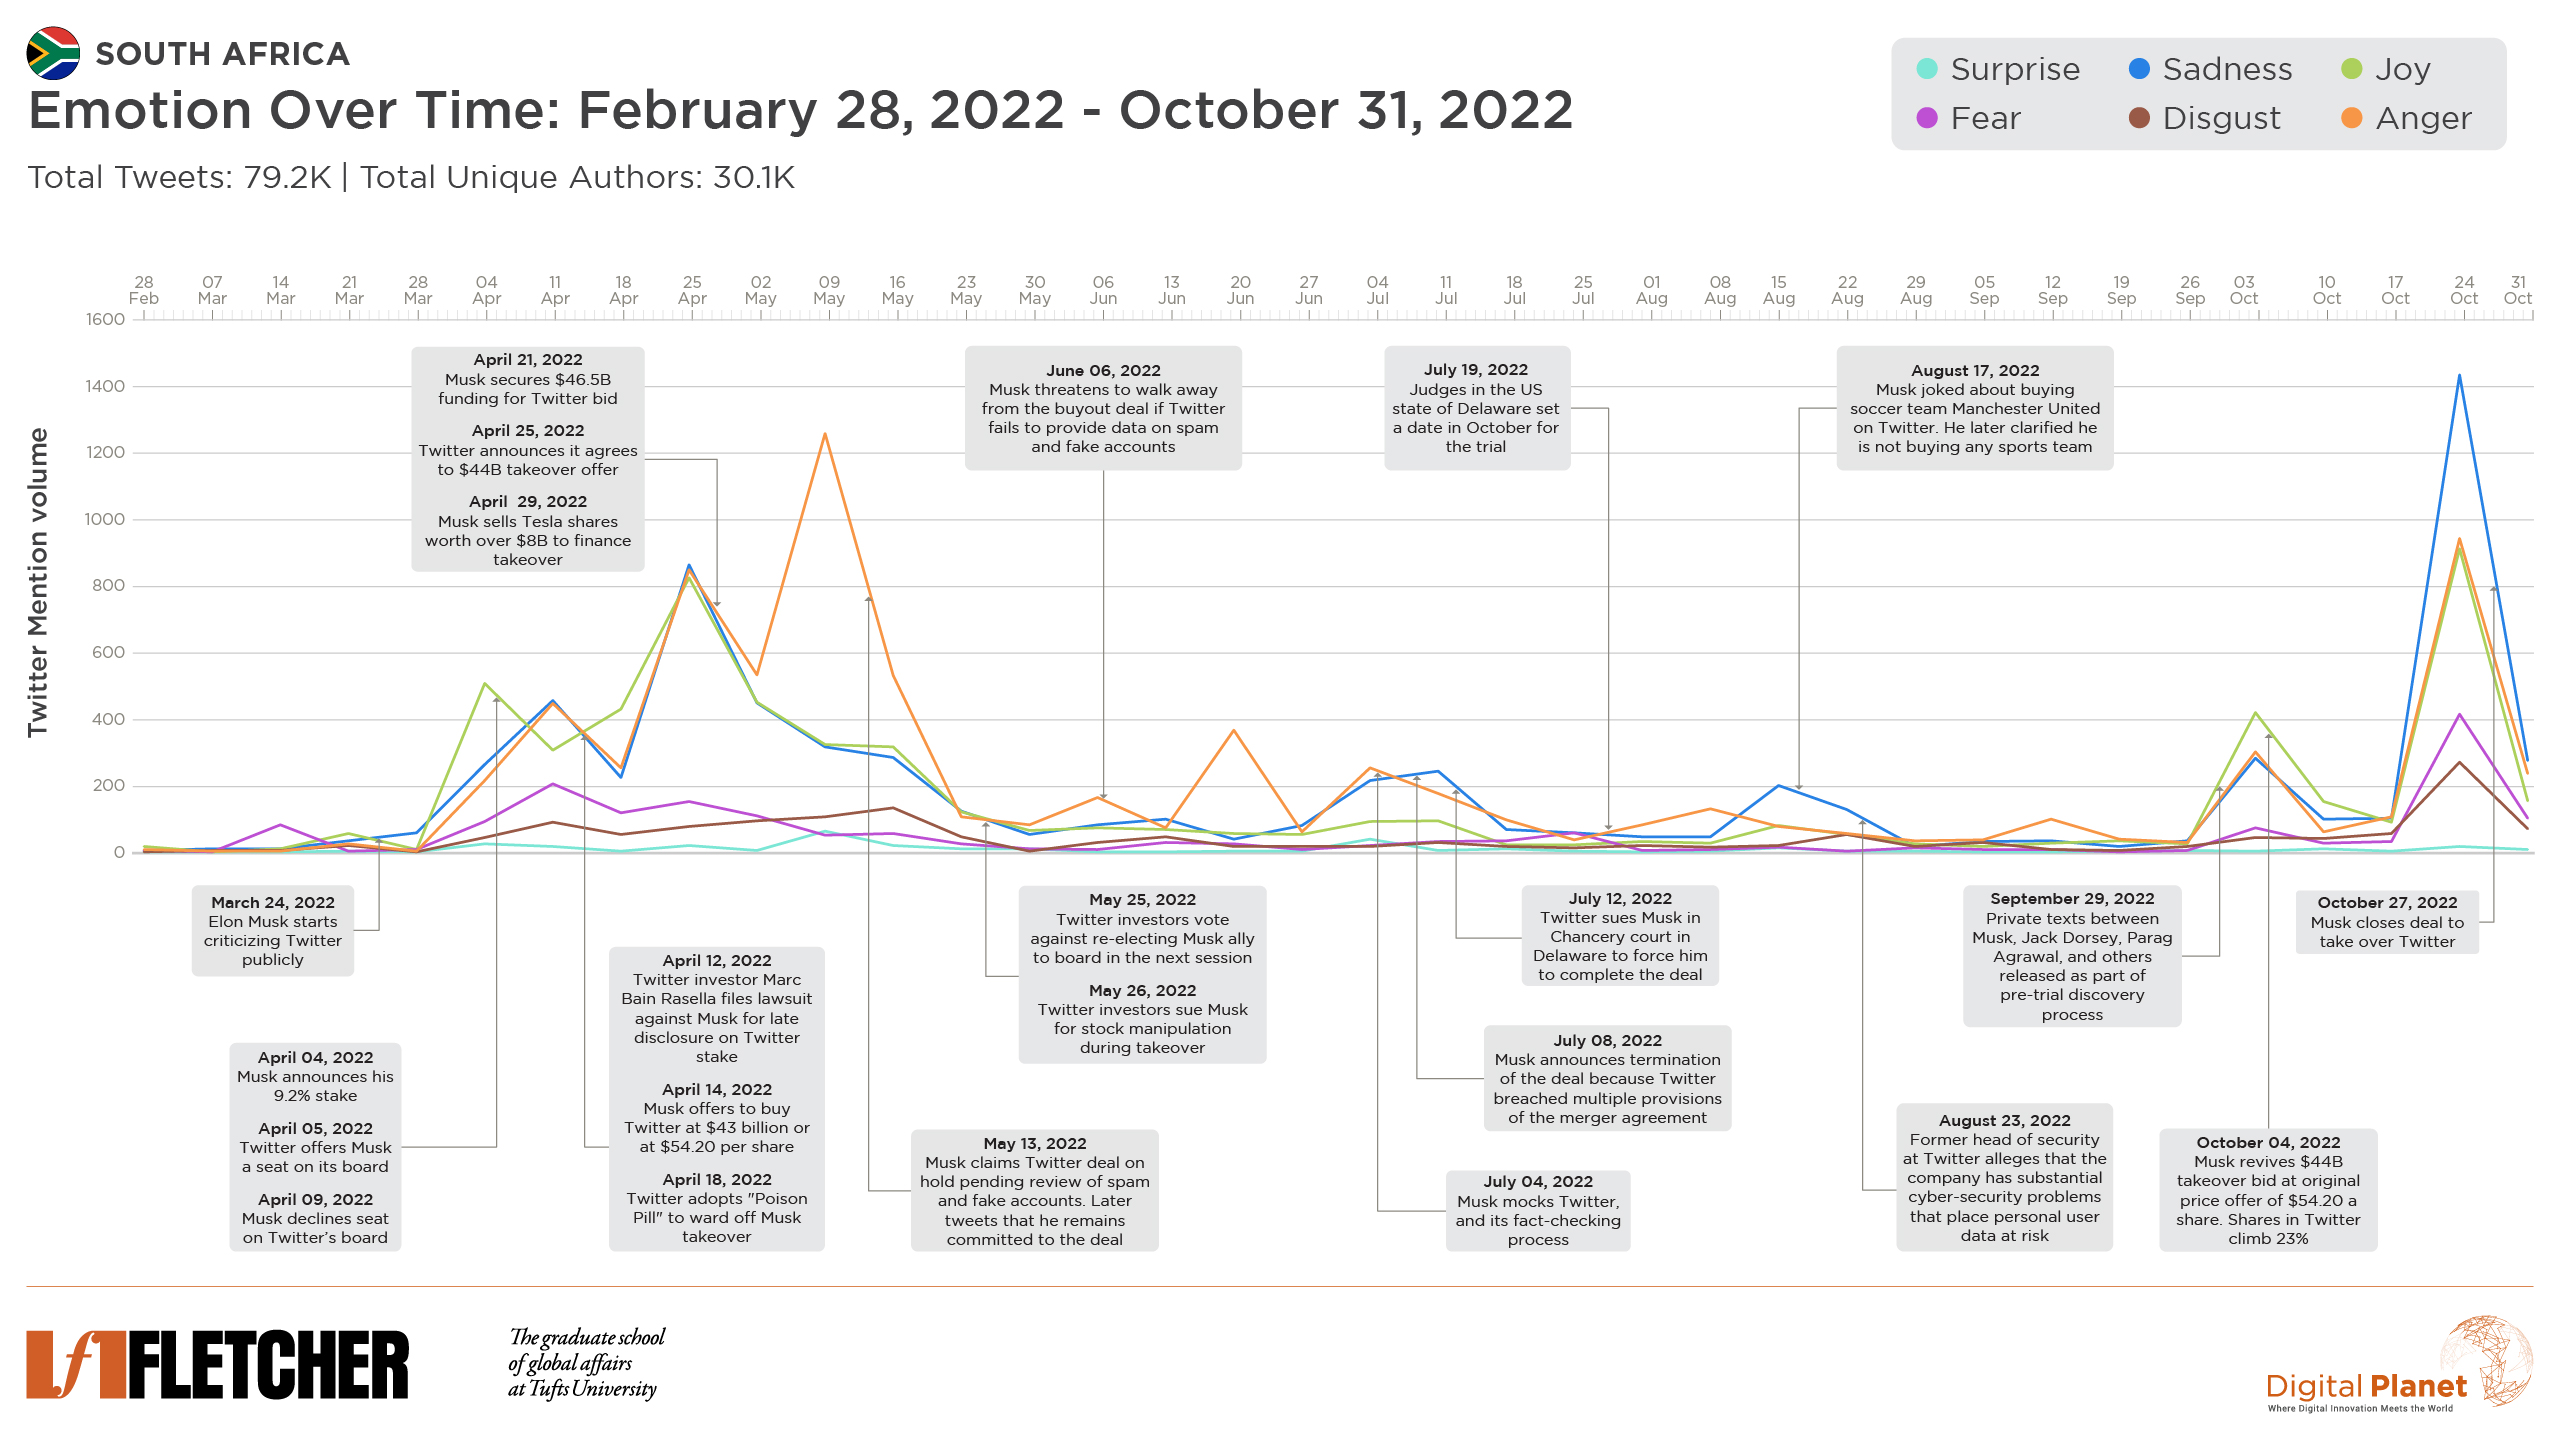
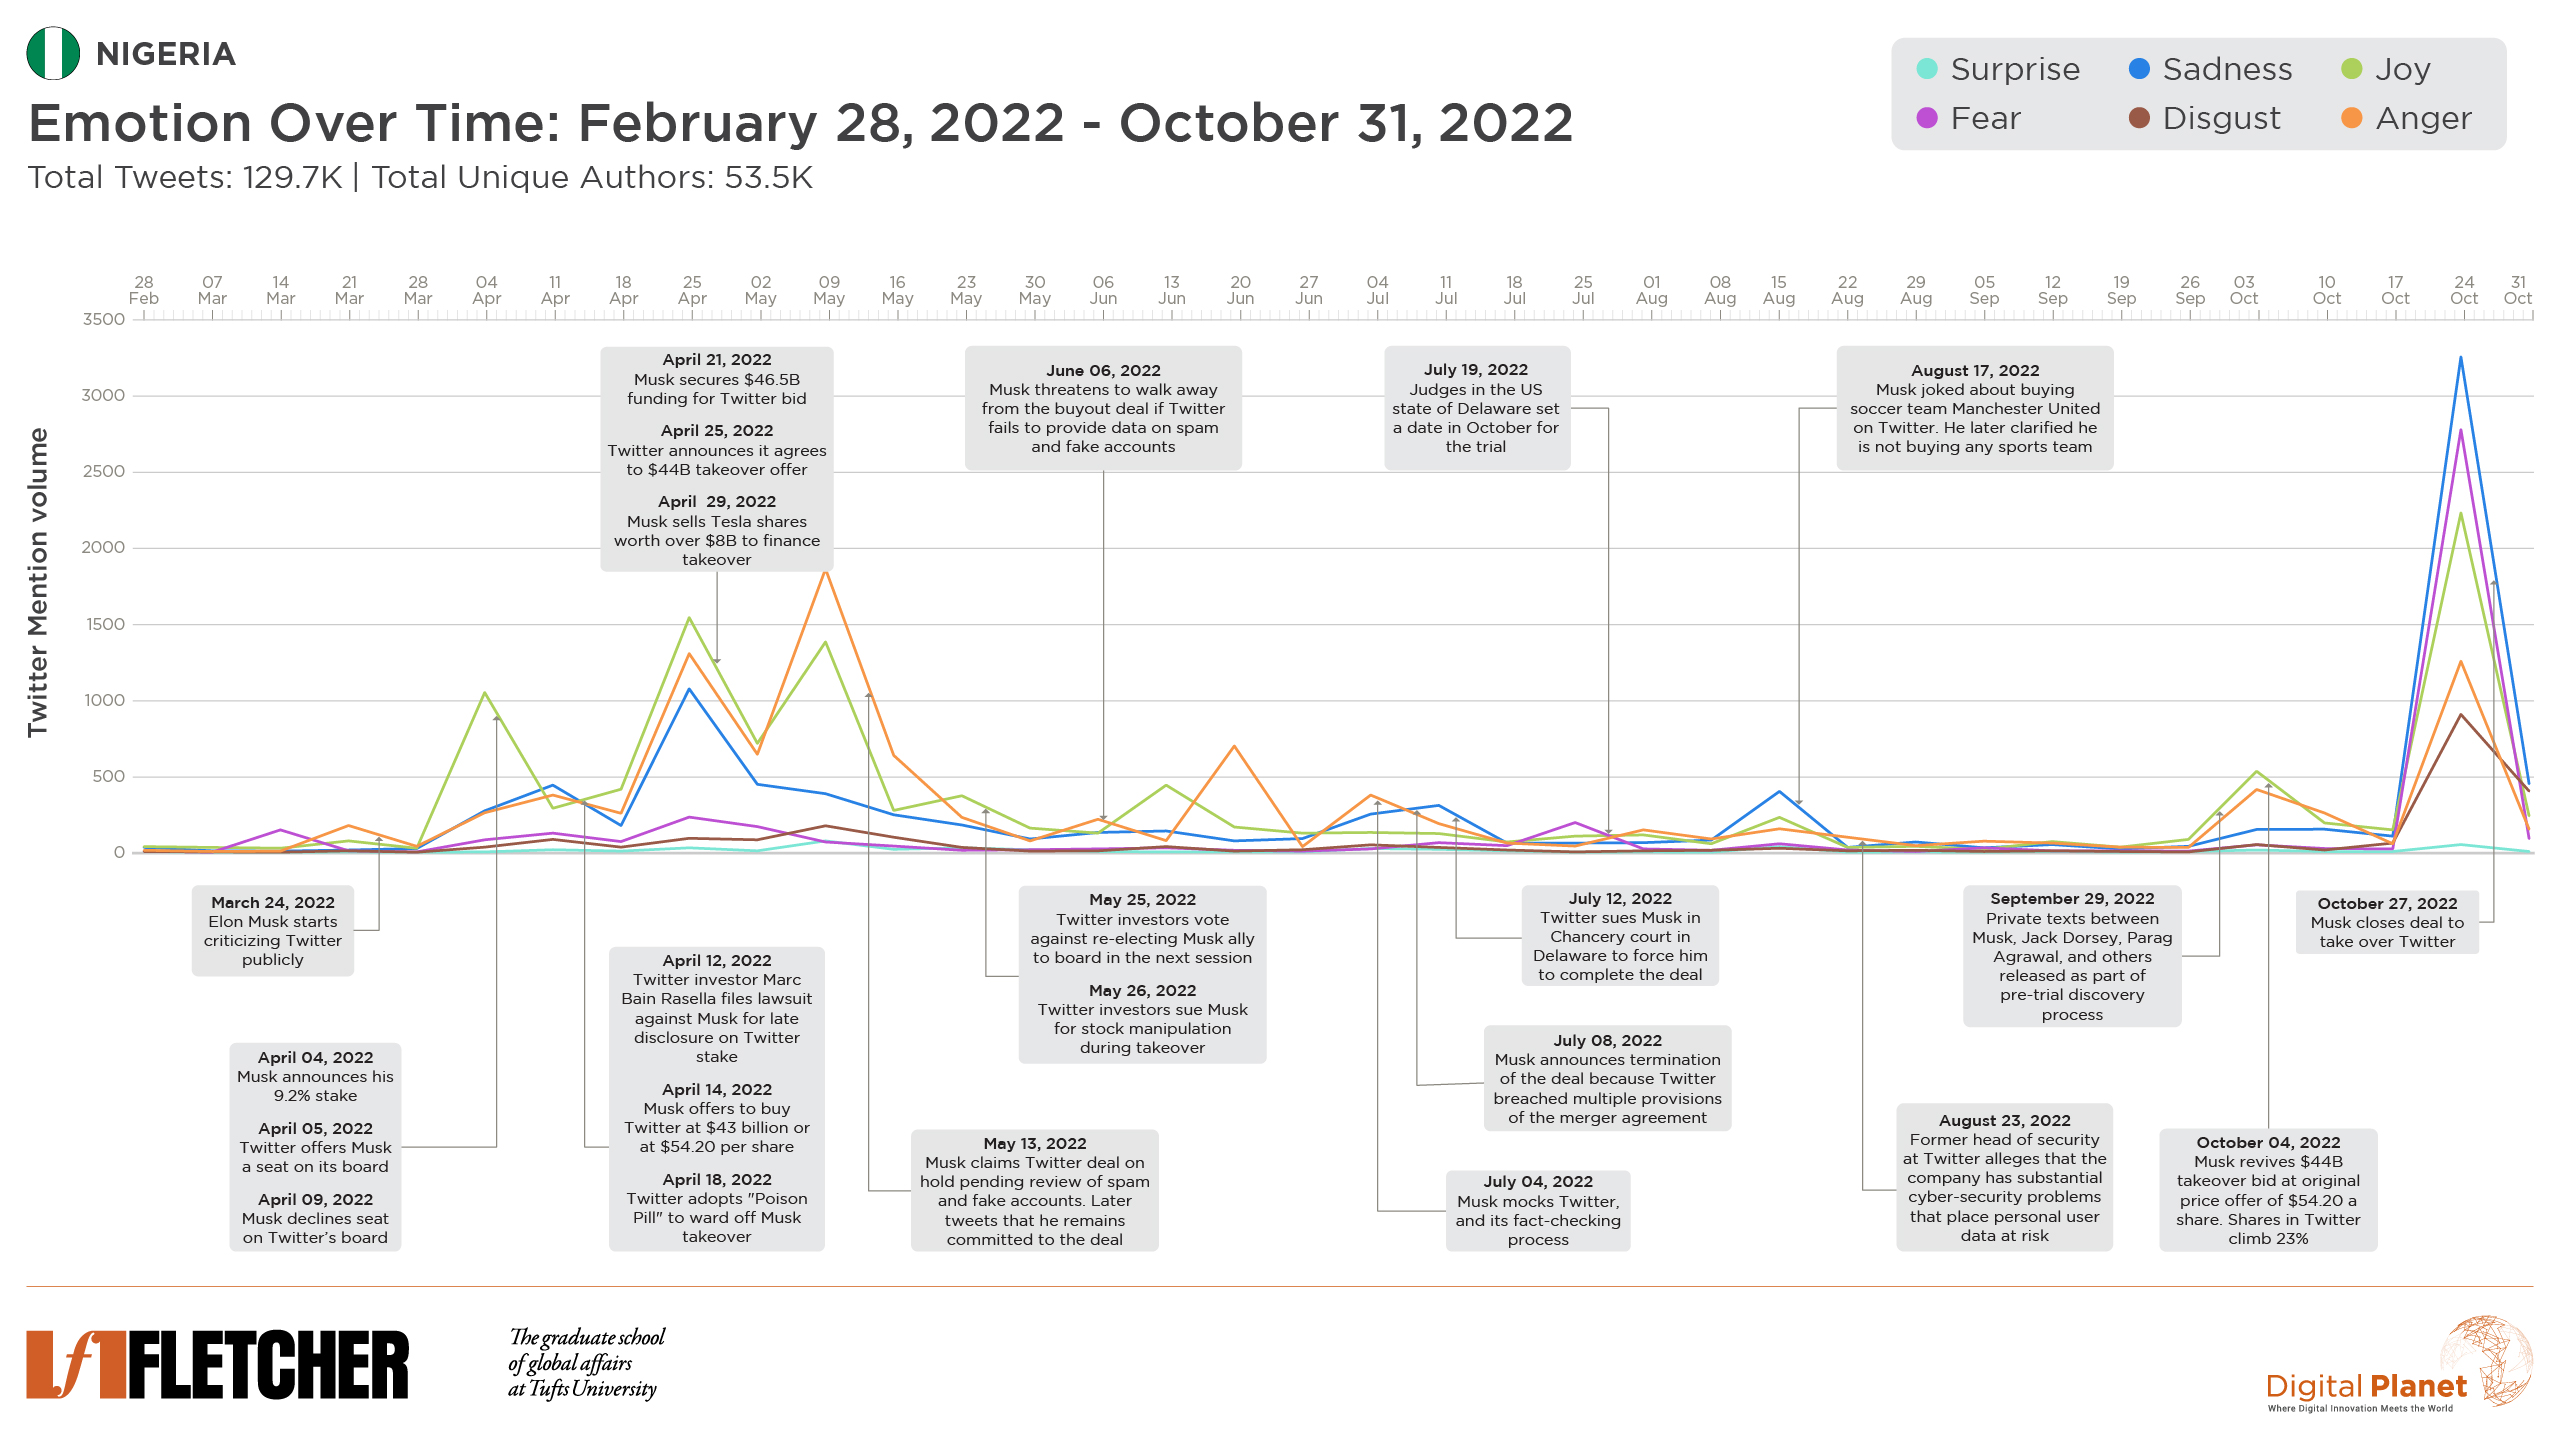
A more nuanced picture emerges from our multi-country analysis on the timeline. Below, we have disaggregated the negative and positive sentiments into the Six Basic emotions: surprise, sadness, joy, fear, disgust, and anger. When interpreting the charts, it is important to note that while there are times where joy alone appears to be the dominant emotion expressed, the sum of more negative emotions like sadness, fear, disgust, and anger taken together paint a different picture of negative reactions outstripping positive ones. Indeed, across all countries studied, when the final takeover deal was announced and when the deal was finalized, negative expressions exceeded positives.
In the US, Musk’s initial offer to buy Twitter was met with a burst of sadness and anger. These same sentiments dominated Musk’s October revival of his initial $44 billion takeover bid. Sadness and anger also remained at the top on the day Musk took over, but joy also spiked that week.
Like in the US, users from the UK reacted to the news of Elon’s offer to buy Twitter with sadness and anger, and replayed those emotions when reports emerged that the company was nearing a deal with Musk. These sentiments towards Musk have largely been consistent over time. A spike in sadness was observed on August 16th when Musk joked about buying Manchester United (one of the most loved football teams in the United Kingdom). Another noticeable spike in anger was experienced when Musk revived his $44 billion takeover bid. However, UK users expressed nearly the same level of joy as anger following the revival bid. On September 5th, Musk tweeted “Tolkien is turning in his grave” – a reference to Amazon’s “Lord of the Rings: The Rings of Power” series, sparking a noticeable spike of sadness in the UK. When Musk showed up to Twitter HQ with a sink, UK users expressed sentiments similar to US users — mostly sadness and anger, but more joy than seen in past peaks.
In India, Musk’s announcement of his 9.2% stake generated a spike of joy whereas his offer to buy Twitter was met with a mix of joy, anger, and sadness. While joy spiked at the announcement of the deal—more so than in any other country we studied—taken together, the more negative emotions (sadness, anger, and fear) dominated Indian Twitter for the day. Since then, while the Musk – Twitter stand-offs have not created as much activity, the sentiment observed around these conversations largely remains to be anger and sadness. A slight spike in anger, joy, and sadness (in that order) was observed around Musk’s revival of his $44 billion takeover bid. In contrast to the US and UK, on the day of the final takeover, sadness was the top sentiment by far, but was followed by joy. There was far less anger on Indian Twitter about the takeover.
Reactions in South Africa, Musk’s country of birth, were similar to India’s, in the sense that the 9.2% stake announcement was met with joy and positivity, but as a whole, negative emotions took over as Musk’s true intentions became more apparent. However, Musk’s revival of his $44 billion takeover bid was once again met with joy, although a large number of people expressed anger and sadness. On the final takeover day, tweeters in South Africa mostly expressed sadness, followed by equal parts joy and anger.
Nigeria’s early sentiment graph is similar to India’s and South Africa’s–but that changes considerably when the final takeover is complete. A significant spike in joy when Musk announced his stake led to a more complex picture as events unfolded, with negative emotions dominating the day when Musk offered to buy the company and on the day the takeover deal was apparently “finalized” in April. Yet, during those same events joy still showed significant spikes, indicating polarization among the Nigerian Twitter community. This trend extended to Musk’s revival of his $44 billion takeover bid.
Once the takeover was complete, and Musk walked into Twitter HQ, like other countries, sadness was the top emotion, but unlike other countries, fear is the second most common emotion. Twitter serves as a key platform to hold the Nigerian government accountable. After Twitter deleted a June 2021 tweet from President Buhari, tagging it as “genocidal” and against the platform’s policies, the Nigerian government banned Twitter for seven months. Nigerians are concerned that Musk’s free speech absolutist approach may end up reducing their ability to express themselves and hold their government to account.
What patterns and insights do you see in these charts? Share your thoughts with us on Twitter @dgtl_planet
Methodology
We use specialized social listening technology and AI and Natural Language Processing (NLP) algorithms to access and analyze large amounts of open-source data. For the purpose of this analysis, we have assembled a dataset of over 16.3 million social-media posts, between Feb 28 and October 31, 2022, related to various events in Elon Musk’s Twitter takeover. Furthermore, we have analyzed sentiments and emotions across 5 countries: US, UK, India, South Africa, and Nigeria for this timeline and this topic.
We have cleaned up the dataset to exclude spam posts and other irrelevant topics. Given the high visibility and involvement of @elonmusk on Twitter across diverse topics, there are many “hijackers” that tag this handle to gain visibility for their tweets—regardless of topic. Most of these spam topics were related to various crypto/NFTs schemes and tokens, and many sub-topics related to the Ukraine-Russia conflict.
Data Limitations:
Given the high volume of posts and length of the timeline, we cannot collect, measure and analyze every single tweet related to this topic. Our access to the Twitter API algorithmically downsamples the data collected, but the overall trend and patterns are consistent with the full sample.
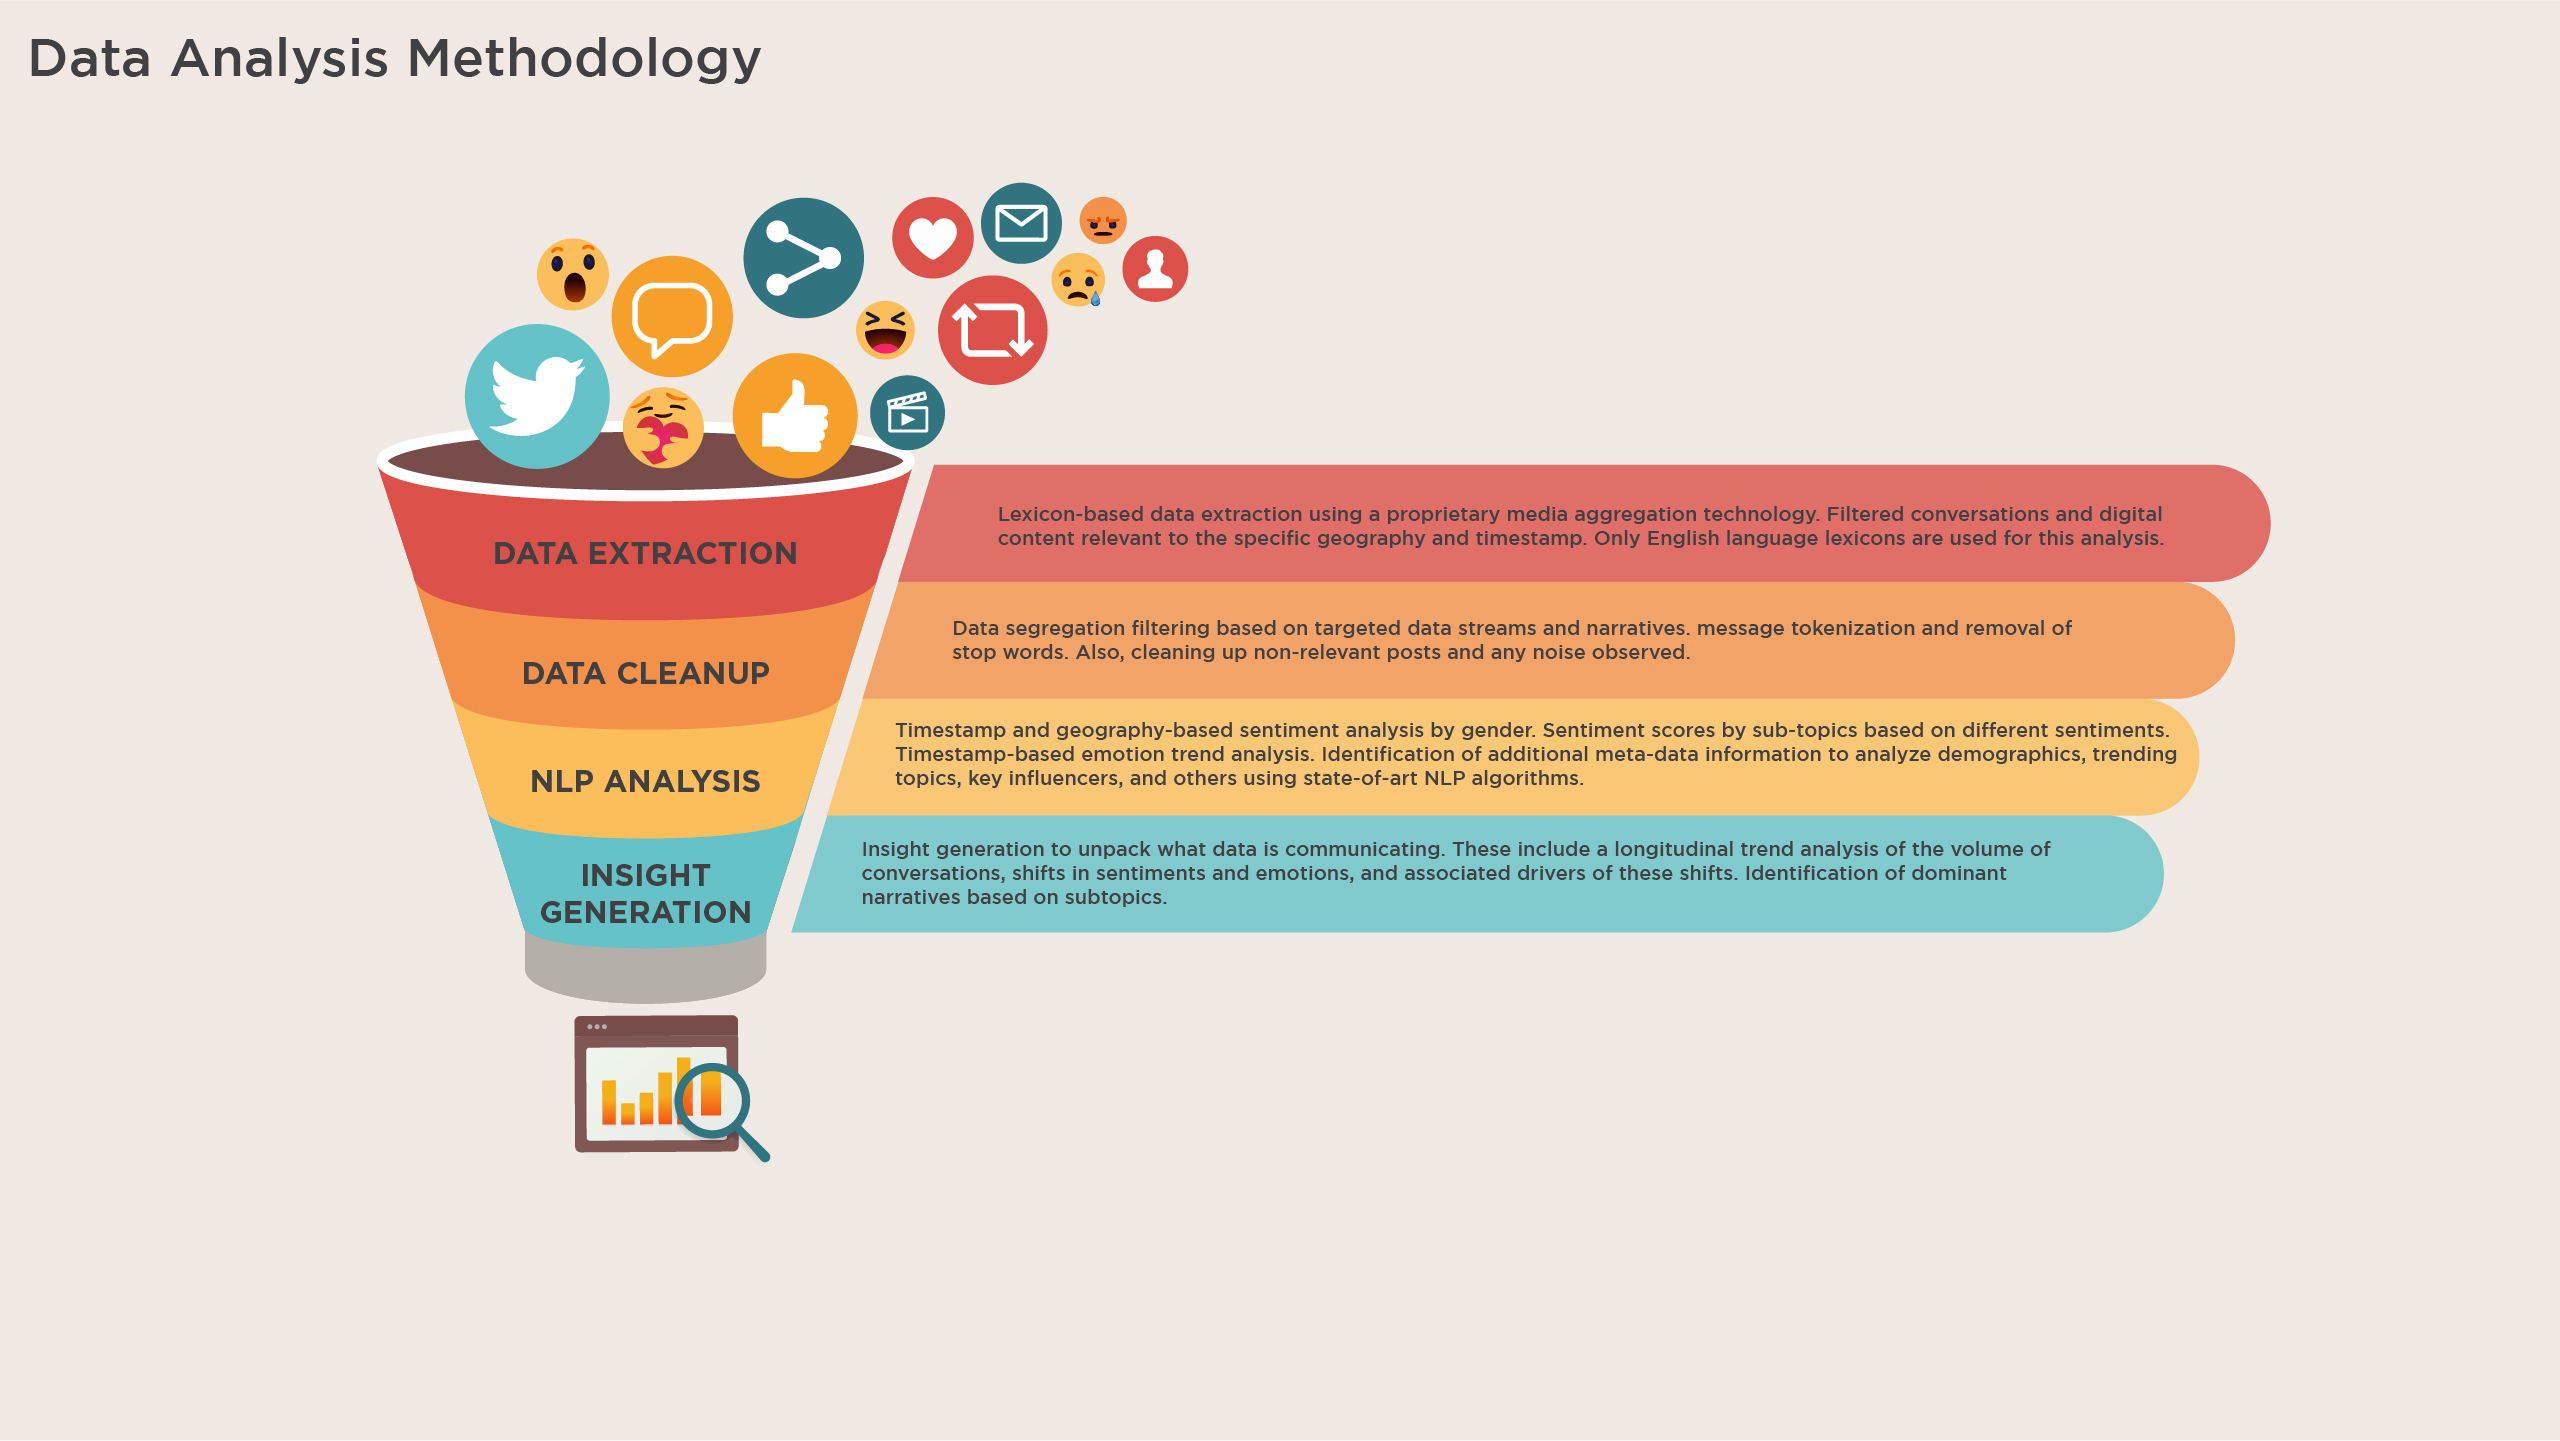
We follow four broad steps to conduct data driven analysis as shown in the below exhibit.
These four broad steps encompass different processes and analysis techniques which allows us to conduct an in-depth analysis of the collected data. Some of the key analysis methods apply as part of this research study are as described below:
Longitudinal tracking
We conducted time-series analysis for various aspects of our data set. For example, we examined trends for the volume of conversations and sentiment and emotion mappings. These trend analyses can be conducted on various time intervals including hours, days, weeks, and months. For this study, we have aggregated data every week and, in some cases, daily.
Sentiment analysis
Sentiment analysis (also known as opinion mining) refers to the use of natural language processing, text analysis, and computational linguistics, to systematically identify, extract, quantify, and study affective states and subjective information. A basic task in sentiment analysis is classifying the polarity of a given text at the document, sentence, or feature/aspect level—whether the expressed opinion in a document, a sentence, or an entity feature/aspect is positive, negative, or neutral. Through our Natural Language Processing algorithms, we can tell whether a particular message is:
- Negative (e.g., the user was angry, disappointed, or just had a bad experience with another post, topic or online user),
- Positive (e.g., the user was happy and positive towards a certain topic, post or online user),
- Neutral (e.g., the user was conversing about less critical issues or gives non-emotional feedback on a particular topic or user).
Emotion analysis
We share our opinions about all kinds of things online, but we also share how we feel. Emotion analysis is similar to sentiment analysis. However, it is more nuanced and can unpack both positive and negative sentiments into six underlying emotions. For the analysis, we used Seismic, an internal tool at Ripple Research that categorizes social mentions by emotion depending on their content. We use the list of six basic emotions as defined by the famous psychologist Paul Ekman to classify mentions:
- Anger
- Disgust
- Fear
- Joy
- Surprise
- Sadness
By using a custom statistical NLP classifier our algorithm automatically assigns emotions to text.
Trending topics identification
Finding trending subtopics related to or under a broad topic can be an important tool to understand what narratives are driving audience opinion. This analysis also shows sub-topics that “fade away” and sub-topics that tend to be “sticky”.
Demographic insights
Insights into demographics let us learn about the people behind a conversation. We can extract demographic data from Twitter and can analyze the people within our dataset both as a group and as individuals, including their:
- Account type (whether they are an organization or an individual)
- Gender
- Interests
- Profession
- Location
A brief note here—we can only extract those data points which are self-mentioned.
Engagement pattern identification
Engagement patterns are useful to identify when and how the audience interacts with the research topic. Through this, we can gain additional insights on online activity, day of the week, and even time of the day when the activity is high.
Digital Pulse, an initiative of Digital Planet, is a platform for measuring and understanding evolving sentiments and responses, expressed online by people around the world, to breaking events globally by harnessing unstructured data. The gathering and analysis of unstructured data is conducted by Ripple Research, a Digital Planet affiliate, under our direction and guidance.
What patterns and insights do you see in these charts? Share your thoughts with us on Twitter @dgtl_planet
Interested in learning more? Subscribe to our monthly newsletter Dispatches from the Digital Planet to stay up to date with our latest research and analysis


