
We use specialized technology and algorithms to access and analyze large amounts of open-source data. We have cleaned up the dataset to exclude spam tweets and other irrelevant topics.
We follow four broad steps to conduct data driven analysis as shown in the below exhibit.

These four broad steps encompass different processes and analysis techniques which allows us to conduct an in-depth analysis of the collected data. Some of the key analysis methods apply as part of this research study are as described below:
Longitudinal tracking
We conducted time-series analysis for various aspects of our data set. For example, we examined trends for the volume of conversations and sentiment and emotion mappings. These trend analyses can be conducted on various time intervals including hours, days, weeks, and months. For this study, we have aggregated data every week and, in some cases, daily.
Sentiment analysis
Sentiment analysis (also known as opinion mining) refers to the use of natural language processing, text analysis, and computational linguistics, to systematically identify, extract, quantify, and study affective states and subjective information. A basic task in sentiment analysis is classifying the polarity of a given text at the document, sentence, or feature/aspect level—whether the expressed opinion in a document, a sentence, or an entity feature/aspect is positive, negative, or neutral. Through our Natural Language Processing algorithms, we can tell whether a particular message is:
- Negative (e.g., the user was angry, disappointed, or just had a bad experience with another post, topic or online user),
- Positive (e.g., the user was happy and positive towards a certain topic, post or online user),
- Neutral (e.g., the user was conversing about less critical issues or gives non-emotional feedback on a particular topic or user).
Emotion analysis
We share our opinions about all kinds of things online, but we also share how we feel. Emotion analysis is similar to sentiment analysis. However, it is more nuanced and can unpack both positive and negative sentiments into six underlying emotions. For the analysis, we used Seismic, an internal tool at Ripple Research that categorizes social mentions by emotion depending on their content. We use the list of six basic emotions as defined by the famous psychologist Paul Ekman to classify mentions:
- Anger
- Disgust
- Fear
- Joy
- Surprise
- Sadness
By using a custom statistical NLP classifier our algorithm automatically assigns emotions to text.
Trending topics identification
Finding trending subtopics related to or under a broad topic can be an important tool to understand what narratives are driving audience opinion. This analysis also shows sub-topics that “fade away” and sub-topics that tend to be “sticky”.
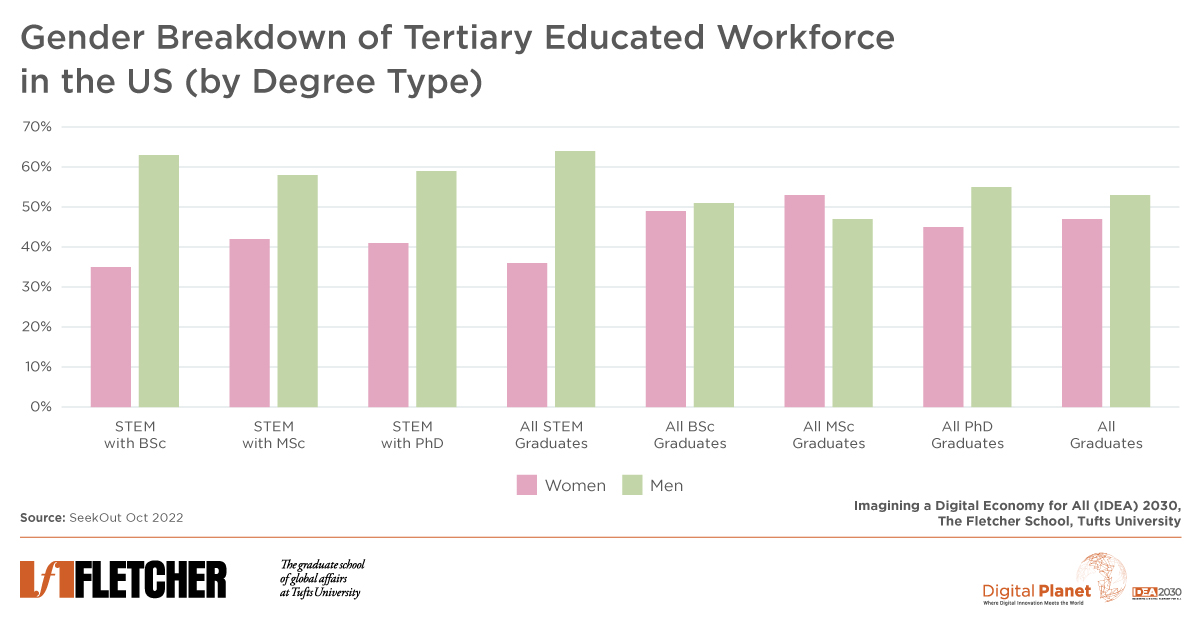
Demographic insights
Insights into demographics let us learn about the people behind a conversation. We can extract demographic data from Twitter and can analyze the people within our dataset both as a group and as individuals, including their:
- Account type (whether they are an organization or an individual)
- Gender
- Interests
- Profession
- Location
A brief note here—we can only extract those data points which are self-mentioned.
Engagement pattern identification
Engagement patterns are useful to identify when and how the audience interacts with the research topic. Through this, we can gain additional insights on online activity, day of the week, and even time of the day when the activity is high.
Digital Pulse is a platform for measuring and understanding the public’s evolving sentiments and responses to breaking events. Conceived by Digital Planet as part of the IDEA 2030 initiative, Digital Pulse harnesses unstructured data to gauge the reactions of various online communities across the globe to key events. Data gathering and analysis were conducted by Ripple Research, an IDEA 2030 affiliate, under the direction and guidance of the Digital Planet team.
What patterns and insights do you see in these charts? Share your thoughts with us on Twitter @dgtl_planet
Interested in learning more? Subscribe to our monthly newsletter Dispatches from the Digital Planet to stay up to date with our latest research and analysis.

