


AI and the Emerging Geography of American Job Risk

AI and the Emerging Geography of American Job Risk
One of the most significant questions surrounding the impact of Artificial Intelligence (AI) has to do with how it affects jobs, and consequently, the incomes across occupations and industries and local economies. AI-driven job vulnerability is uneven but material. Even as the technology continues to evolve — with breakthroughs and setbacks alike — and as organizations and workers adapt in real time, the broad outlines of the emerging geography of American job risk due to AI are becoming clear.
With the objective of providing a comprehensive overview of AI’s impact on jobs, incomes, and economies across the U.S., we introduce the American AI Jobs Risk Index, ranking occupations, industries, regions and states by vulnerability based on the most current understanding of AI’s evolving impact. The index will be updated as new information emerges both due to the evolution of AI’s capabilities and with how it is being integrated into the future of work.
The American AI Jobs Risk Index enters a crowded field, Goldman Sachs, MIT’s Iceberg Index, the Yale Budget Lab, Stanford’s “Canaries in the Coal Mine,” the WEF Future of Jobs Report, and numerous other studies have all assessed AI’s labor market impact. Yet, it breaks new ground in several essential areas by highlighting vulnerability (job displacement), not just exposure, identifying the geographic areas affected down to every metro and non-metro level rather than focusing only on occupations and industries. It also associates these vulnerabilities with the economic impact of lost income and helps translate the findings into potential actions, recognizing that many of these actions will need to be implemented at the local level.
What is new here?


By identifying the occupations that represent the tipping point for potential job displacement, the American AI Jobs risk index helps pinpoint the specific workers most likely to benefit from targeted interventions such as reskilling, workforce transition programs, and policy support. In addition, the analysis highlights a small group of states experiencing the largest projected income losses. Notably, many of these states are also among the most active in pursuing AI regulation, underscoring the political and political economy dimensions of AI-driven labor disruption and pointing to significant state-level regulatory and policy implications. This insight is particularly timely, as the federal government is expected to soon announce which state-level AI laws it considers “onerous” and may refer to the Department of Justice’s AI Litigation Task Force for further review.
Note, in this current iteration, we deliberately excluded new job creation and economic benefits from Artificial Intelligence from the Index; however, as more robust evidence becomes available, we intend to incorporate these dynamics in future updates.
The findings above and others in report yield 8 broad takeaways:
The key contribution of this research is not any single finding but the combination: a unified framework that simultaneously maps exposure, vulnerability, income effects, geographic concentration, and adoption scenarios across the entire U.S. economy. Moreover, the geographic and economic breakdowns of the impact directly translate into action implications.
There are several actionable recommendations for policymakers, political actors, technologists and business. They include:
“However much we may welcome the fruits of advancing technology — however optimistic one may be that the problems of adjustment will not be serious — no one dare overlook or deny the fact that many individuals will suffer personal, mental, and physical hardships as the adjustments go forward.”
Over seventy years later, Congress could issue the same warning. The technology has changed — from assembly-line automation to artificial intelligence — but the core tension has not: how do we capture the productivity gains of a transformative technology without leaving workers behind? This research reveals that we are once again at that inflection point, and that the window for pre-emptive action is narrow.
What makes this moment different from previous waves of automation is not just the speed of AI’s advancement, but its reach. Earlier automation largely displaced routine, physical, and lower-wage work. AI is moving up the income ladder — targeting the cognitive, analytical, and creative tasks that define white-collar, knowledge-intensive jobs. The workers most at risk today are not on factory floors; they are in offices, on campuses, and in the innovation hubs that have long been considered insulated from technological disruption.
As the research has grown, so has the public debate — and the distance between its poles. On one end, Dario Amodei, CEO of Anthropic, predicted in May 2025 that AI could eliminate half of all entry-level white-collar jobs and spike unemployment to 10–20% within five years, urging business leaders and policymakers to stop “sugar-coating” the impact.
On the other, White House AI and Crypto Czar David Sacks has dismissed job loss concerns as a “hoax,” arguing that AI is making workers more productive and driving gains in both jobs and wages. A middle position comes from OpenAI CEO Sam Altman, who acknowledges displacement is occurring but argues that some firms are “AI-washing” — overstating AI’s role in layoffs that would have happened anyway, effectively muddying the evidentiary waters.
Beyond the executive suite, prominent economists and policymakers have sounded louder alarms. Former Commerce Secretary Gina Raimondo and Nobel laureate Joseph Stiglitz have both raised concerns about AI’s broader economic implications — particularly its potential to concentrate gains at the top while hollowing out wages and employment for everyone else. Researchers at Citrini Research have put a striking name to this risk: a “Global Intelligence Crisis,” outlining a scenario in which AI-driven output inflates the numbers recorded in national accounts while the underlying gains never circulate through the broader economy. They call the result “ghost GDP” — an economy that appears to grow statistically even as wages, employment, and household income stagnate.
Financial markets have already begun pricing in these productivity shocks — and the signals are mixed at best. When fintech firm Block announced layoffs affecting roughly 40% of its workforce as part of an AI-driven restructuring, its stock rose approximately 20%, as investors bet that automation would boost efficiency and margins. A similar dynamic played out across the software sector when new Claude-based AI tools capable of automating enterprise workflows were released: analysts dubbed the ensuing selloff a “SaaSpocalypse,” which wiped roughly $285 billion from the market value of software companies as investors reassessed the long-term viability of traditional SaaS business models. Taken together, these contrasting reactions illustrate just how much uncertainty — and motivated reasoning — surrounds AI’s current and future employment effects.
A growing body of work has attempted to measure AI’s impact on employment. Studies including the oft-cited “Canaries in the Coal Mine” from Brynjolfsson et al. (2025), the Yale Budget Lab analysis by Gimbel et al. (2025), government employment projections by Machovec et al. (2025), Murray (2025), Goldman Sachs (2025), Eloundou et al. (2023), and Georgieff et al. (2022) have constructed AI exposure scores, augmentation scores, and automation scores across U.S. and global labor markets. Most of this research tends to agree on which jobs are most exposed — high-earning, technical, and administrative — but diverges significantly on the magnitude.
Critically, much of this work focuses primarily on exposure — how much a job’s tasks can be reached by AI — rather than vulnerability, meaning how likely that exposure is to result in actual job loss. That distinction matters enormously for policy. In addition to the exposure research, several studies have attempted to measure AI’s real-time labor market effects. The evidence is mixed, but suggests that (1) the aggregate impact on overall employment remains relatively small, and (2) AI-exposed entry-level jobs are likely already in decline. Other signals outside the unemployment rate point to broader disruption, with white-collar payrolls and hiring declining in ways typically only seen during recessions, alongside wage deflation and reduced benefits.
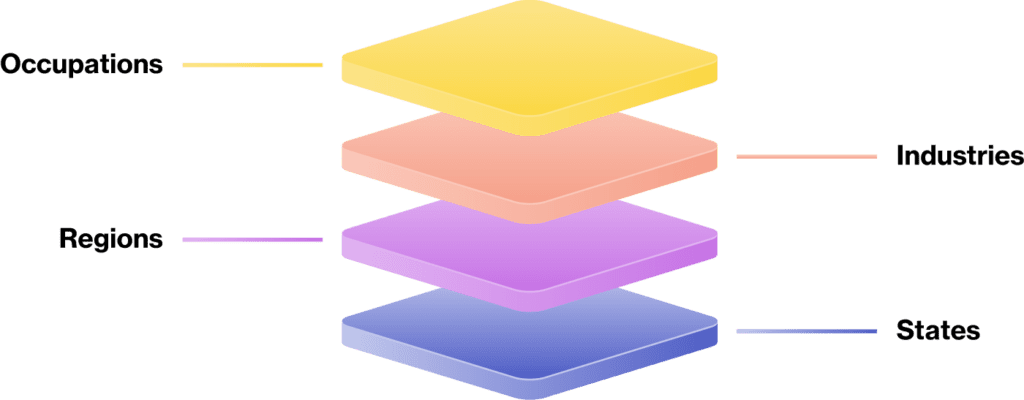
The American AI Jobs Risk Index cuts through the noise with a data-driven framework that is analytical, forward-looking, and grounded in the best available projections — while recognizing that the technology, and its labor market effects, are evolving faster than any single study can fully capture. Unlike much of the existing research, which focuses primarily on exposure scores at the occupational level, the Index goes further by projecting actual vulnerability to job loss, mapping impacts across industries, regions, and states, and modeling outcomes across multiple AI adoption scenarios. The Jobs Risk Index covers four key dimensions:
The Index will be updated on a regular cadence, to capture the latest changes in the labor market.
Although there is increasing discussion about AI creating new roles, the empirical evidence on net job creation and which future jobs will be in high demand remains limited. The World Economic Forum projects substantial new employment opportunities in the coming years, but these projections rely largely on employer surveys and forward-looking estimates rather than realized labor market outcomes. To maintain methodological rigor, we made the deliberate decision to exclude new job creation from the current version of the Index — as more robust evidence accumulates, we intend to incorporate these dynamics in future updates.
Artificial Intelligence exposure refers to how much a job’s core tasks can be influenced by AI technologies, without yet judging whether that influence results in enhanced productivity or job displacement. In other words, AI Exposure captures how reachable a job is by AI, not necessarily how replaceable it is.
Previous studies like Eloundou et al. (2023) describe AI exposure as the extent to which the tasks performed within an occupation can be affected by large language models (LLMs) and related generative systems. Brynjolfsson et al. (2018) on the other hand define exposure as the degree to which the skills required in a job can be performed by modern AI systems, particularly those relying on machine learning and large language model capabilities. Similarly, Felten et al. (2018) define AI exposure as the extent to which advances in AI capabilities, both cognitive and physical, align with the abilities needed to perform a given job’s tasks. Taken together, these definitions emphasize that AI exposure measures technological proximity rather than labor market outcome. High exposure signals that AI tools could meaningfully alter how tasks are completed, not necessarily who completes them. Understanding this nuance is essential before assessing the second dimension of this report, AI job loss vulnerability, which focuses on the likelihood that exposure translates into actual job loss or restructuring.
| Occupation | Exposure Score | Top 20: Rank |
|---|---|---|
| Web and Digital Interface Designers | 100 | 1 |
| Web Developers | 98.3 | 2 |
| Database Architects | 98 | 3 |
| Computer Programmers | 97.1 | 4 |
| Data Scientists | 96.9 | 5 |
| Financial Risk Specialists | 96.7 | 6 |
| Court Reporters and Simultaneous Captioners | 96.4 | 7 |
| Information Security Analysts | 95.8 | 8 |
| Database Administrators | 94.4 | 9 |
| Medical Records Specialists | 94.1 | 10 |
| Public Relations Managers | 92.5 | 11 |
| Computer Network Architects | 92.4 | 12 |
| Software Quality Assurance Analysts and Testers | 91.7 | 13 |
| News Analysts, Reporters, and Journalists | 91.7 | 14 |
| Software Developers | 89.5 | 15 |
| Project Management Specialists | 87.5 | 16 |
| Network and Computer Systems Administrators | 87.5 | 17 |
| Fundraising Managers | 87.5 | 18 |
| Health Information Technologists and Medical Registrars | 87.5 | 19 |
| Sales Representatives of Services, Except Advertising, Insurance, Financial Services, and Travel | 86.7 | 20 |
| Occupation | Exposure Score | Bottom 20: Rank |
|---|---|---|
| Explosives Workers, Ordnance Handling Experts, and Blasters | 20 | 738 |
| Tire Repairers and Changers | 19.1 | 739 |
| Stonemasons | 19 | 740 |
| Nursing Assistants | 18.2 | 741 |
| Pressers, Textile, Garment, and Related Materials | 18.2 | 742 |
| Railroad Brake, Signal, and Switch Operators and Locomotive Firers | 17.9 | 743 |
| Crematory Operators | 16.7 | 744 |
| Fast Food and Counter Workers | 14.3 | 745 |
| Aircraft Service Attendants | 13.9 | 746 |
| Welders, Cutters, Solderers, and Brazers | 13.6 | 747 |
| Slaughterers and Meat Packers | 13.1 | 748 |
| Massage Therapists | 12.3 | 749 |
| Molders, Shapers, and Casters, Except Metal and Plastic | 12 | 750 |
| Loading and Moving Machine Operators, Underground Mining | 10.7 | 751 |
| Surgical Assistants | 7.1 | 752 |
| Fiberglass Laminators and Fabricators | 6.3 | 753 |
| Coating, Painting, and Spraying Machine Setters, Operators, and Tenders | 5 | 754 |
| Orderlies | 4.2 | 755 |
| Excavating and Loading Machine and Dragline Operators, Surface Mining | 0 | 756 |
| Roof Bolters, Mining | 0 | 757 |
Sources: Digital Planet, The Fletcher School, Tufts University, Eloundou et al. (2023); Brynjolfsson et al. (2018) ; Felten et al. (2018)
Task augmentation refers to the extent to which artificial intelligence enhances, rather than replaces, the tasks performed within an occupation. While automation measures the share of tasks that AI can fully execute on its own, augmentation captures the share of tasks where AI serves as a complementary tool, improving speed, accuracy, or productivity while keeping the human worker in the loop. In this sense, augmentation represents the collaborative frontier of AI, where technology boosts human capability instead of displacing it.
A clear pattern emerges across occupations with the highest potential for augmentation: they are overwhelmingly high-skill, knowledge intensive, and cognitively complex roles. These include historians, physicists, computer programmers, mathematicians, editors, writers, scientists, analysts, and other professional occupations.
Share of Tasks Augmented by AI, by Occupation
Sources: Anthropic Economic Index (2025); Digital Planet, The Fletcher School, Tufts University.
While AI exposure captures how much a job can be affected by emerging technologies, AI job vulnerability goes a step further, it measures how likely that exposure will result in actual job loss or significant restructuring. Vulnerability reflects the translation of technical potential into economic impact, considering both what AI can do and how industries, firms, and workers respond to its adoption.
According to Handa et al. (2025), automation refers to the extent to which large language models (LLMs) can fully perform or reliably substitute the cognitive, information processing, and communication tasks that workers currently execute. They define this process as task substitution, emphasizing that vulnerability depends not only on capability but on real world patterns of AI adoption.
Tomlinson et al. (2025) took a complementary view, defining automation as the probability that an LLM can execute a task end to end, from input to outcome, based on benchmark accuracy and experimental performance across different industries. Together, these definitions highlight that AI job vulnerability is not merely theoretical; it reflects measurable probabilities of replacement where automation proves both technically feasible and economically advantageous.
High-Skill, High-Income Jobs Are Among the Most Vulnerable to AI
Contrary to historical patterns of automation which largely affected routine, lower-wage, manual occupations, the roles most vulnerable to artificial intelligence today are high-income, high-skill, cognitively intensive jobs. The following chart shows that occupations such as computer programmers, writers and authors, editors, database architects, operations research analysts, statisticians, and other professional roles sit at the very top of the vulnerability distribution.
These positions require advanced education, domain expertise, and strong analytical or language-based skills. Yet these same characteristics make them especially susceptible to automation by large language models, which excel in tasks involving reasoning, writing, coding, summarizing, graphic design, visual content creation and information processing.
As a result:
Workers in knowledge-intensive, well-paid occupations now face some of the highest levels of AI-driven job vulnerability in the US labor market.
This marks a significant shift from previous waves of automation and underscores the need for strategic upskilling, task redesign, and AI complementarity within high-skill professions.
Estimated Percentage of Job Loss, by Occupation
Sources: Anthropic Economic Index (2025); Tomlinson et al. (2025); Digital Planet, The Fletcher School, Tufts University
The relationship between augmentation potential and expected job loss is statistically strong, meaning that much of the variation in projected displacement can be explained by how augmentable a job’s tasks are. The mechanism is straightforward: when AI substantially enhances worker efficiency, organizations can produce more with the same headcount, reducing demand for additional hires, often affecting lower or entry level roles first. While there has been some pushback on recent research showing AI-induced job loss among entry-level roles, survey after survey show that business leaders plan to use AI to reduce hiring and replace workers.
This pattern is most apparent in high skill occupations such as writers and authors, editors, computer programmers, web and digital interface designers, operations research analysts, technical writers, database architects, and mathematicians. Their work is highly cognitive, language or analysis intensive, sufficiently structured for large language models to execute, and repeated frequently enough to reshape the task mix of the job. Because large portions of these tasks can be enhanced or, in some cases, completed by AI, these occupations exhibit both higher augmentation and higher displacement.
Occupational Comparison of Task Augmentation and Job Loss Risk
Sources: Anthropic Economic Index (2025); Tomlinson et al. (2025); Digital Planet, The Fletcher School, Tufts University
AI-related job loss risk varies substantially across U.S. industries, with an average vulnerability of roughly 6 percent. The highest-risk sectors include Information (18%), Finance and Insurance (17%), Professional, Scientific, and Technical Services (16%), and Management of Companies (14%). These industries are characterized by a high concentration of digital, rules-based tasks—such as coding support, documentation, claims and know-your-customer (KYC) processing, and shared services—that are particularly susceptible to automation.
Moderate risk is observed in Education (8%), Wholesale Trade (7%), Utilities (7%), and Real Estate (7%), where risk is concentrated in grading and administrative functions, billing and forecasting, contact centers, content operations, and online training.
The lowest levels of risk to job loss (approximately 1% to 4%) are found in Manufacturing, Retail Trade, Health Care and Social Assistance, Mining, Construction, Transportation and Warehousing, Agriculture, Forestry, and Fishing, and Accommodation and Food Services. In these sectors, work tends to be more physical, variable, and safety-critical, limiting the near-term potential for AI-driven job displacement.
These patterns align with prior studies (for example, Goldman Sachs (2025), Microsoft (2025), Yale Budget Lab (2025), and MIT’s Iceberg Index (2025)) that flag software developers, analysts, accountants, legal and administrative support staff, writers, editors, and finance professionals as highly exposed—particularly at the lower levels—because their daily tasks overlap with current AI capabilities such as content generation, document synthesis, coding, pattern recognition, and research.
Percentage of Jobs at Risk Aggregated by Sector
Sources: Anthropic Economic Index (2025); Tomlinson et al. (2025); Digital Planet, The Fletcher School, Tufts University
Employment and Earnings at Risk, Aggregated by Sector
| Industry | % Job Loss | Net Job Loss | % Income Loss | Income Loss | Income Loss to Job Loss Ratio |
|---|---|---|---|---|---|
| Information | 18.3% | 522K | 17.8% | $57.2B | 0.97 |
| Finance and Insurance | 16.5% | 1.0M | 14.6% | $88.8B | 0.89 |
| Professional, Scientific, and Technical Services | 15.6% | 1.7M | 14.7% | $167.0B | 0.94 |
| Management of Companies and Enterprises | 14.1% | 390K | 13.2% | $40.9B | 0.94 |
| Educational Services | 8.3% | 1.1M | 8.2% | $72.3B | 0.99 |
| Federal, State, and Local Government, excluding State and Local Government Schools and Hospitals and the U.S. Postal Service (OEWS Designation) | 7.8% | 757K | 8.3% | $62.2B | 1.06 |
| Wholesale Trade | 7.2% | 429K | 8.2% | $36.4B | 1.14 |
| Utilities | 6.9% | 39K | 7.0% | $4.1B | 1.02 |
| Real Estate and Rental and Leasing | 6.7% | 158K | 6.8% | $10.4B | 1.01 |
| Administrative and Support and Waste Management and Remediation Services | 5.3% | 467K | 6.4% | $31.6B | 1.22 |
| Other Services (except Public Administration) | 5.2% | 224K | 5.8% | $14.0B | 1.12 |
| Arts, Entertainment, and Recreation | 4.7% | 119K | 4.8% | $6.1B | 1.01 |
| Manufacturing | 4.3% | 534K | 6.0% | $50.0B | 1.40 |
| Retail Trade | 3.8% | 596K | 4.1% | $27.9B | 1.07 |
| Health Care and Social Assistance | 3.6% | 819K | 3.6% | $53.7B | 1.00 |
| Mining, Quarrying, and Oil and Gas Extraction | 3.5% | 20K | 4.6% | $2.1B | 1.33 |
| Construction | 2.9% | 237K | 3.1% | $17.4B | 1.04 |
| Transportation and Warehousing | 2.3% | 165K | 2.7% | $11.5B | 1.17 |
| Agriculture, Forestry, Fishing and Hunting | 1.1% | 5K | 1.5% | $279.4M | 1.37 |
| Accommodation and Food Services | 0.6% | 84K | 0.8% | $4.5B | 1.40 |
Sources: Anthropic Economic Index (2025); Tomlinson et al. (2025); Digital Planet, The Fletcher School, Tufts University
The chart indicates that the income composition of AI-related job losses varies significantly by industry. In sectors such as manufacturing, accommodation and food services, agriculture, and mining, AI-driven job losses are more concentrated in relatively higher-income roles within those industries. This pattern reflects the fact that many lower-income jobs in these sectors involve physically intensive tasks that are less amenable to automation.
By contrast, in industries such as finance and insurance and management of companies and enterprises, AI-related job losses are more concentrated in lower-income roles within the industry. These losses are more likely to affect entry-level roles that are usually repetitive such as administrative, clerical, or data-processing positions, which are both lower-paid relative to other roles in the same industry and more exposed to automation. In addition, for many of these types of roles (clerical, administrative), workers may find themselves in a harder position to navigate a job loss. This finding is in line with Microsoft (2025), ADP Research (2025), and Goldman Sachs (2025) that document hiring slowdowns concentrated in junior professional, analytical, and software positions.
Importantly, “high-income” and “low-income” are defined on a within-industry basis rather than across industries, meaning the comparison reflects relative income levels among workers in the same sector.
Income Loss–to–Job Loss Ratio by Sector
Sources: Anthropic Economic Index (2025); Tomlinson et al. (2025); Digital Planet, The Fletcher School, Tufts University.
A ratio greater than 1 indicates that income losses exceed job losses, suggesting that job displacement in these industries is concentrated in higher-wage roles. Conversely, a ratio below 1 indicates that job losses are concentrated in lower-wage positions, where income losses are smaller relative to employment declines. For example, the manufacturing sector exhibits an income-loss-to-job-loss ratio of 1.4. This indicates that, within manufacturing, the positions most vulnerable to AI-driven displacement are relatively high-paying roles—such as corporate or administrative positions—rather than lower-wage factory jobs.
When viewed as a percentage of local employment, potential AI-driven job loss is heavily concentrated in high-skill, innovation-oriented metros such as San Jose, Washington D.C., Durham, San Francisco, Seattle, Austin, Boston, and Raleigh. These cities employ large shares of workers in AI-exposed and AI-vulnerable occupations like software developers, analysts, mathematicians, writers, and other knowledge-intensive roles.
In smaller cities and university towns like Boulder, Lexington Park, Trenton, Tallahassee, Olympia, Ann Arbor, Bloomington, Provo, and Madison, the smaller workforce base amplifies the percentage impact even when absolute job losses are modest.
Potential Job Loss as a Percentage of Local Employment

Sources: Anthropic Economic Index (2025); Tomlinson et al. (2025); Digital Planet, The Fletcher School, Tufts University.
When measured by the total number of jobs displaced, the pattern concentrates in large population centers: New York, Los Angeles, Washington D.C., Chicago, Dallas, Boston, San Franscisco, and Atlanta lead not because they exhibit the highest proportion of vulnerability, but because their vast labor markets convert even moderate vulnerability into large absolute losses. San Jose and Seattle appear on both the percentage loss and total loss lists, reflecting the combination of high vulnerability and significant scale. By contrast, cities with the lowest displacement, on both percentage and total measures, tend to be smaller economies with limited concentrations of knowledge sector employment, such as Guayama, PR; Eagle Pass, TX; Kokomo, IN; Hinesville, GA; Enid, OK; Walla Walla, WA; and Grants Pass, OR. These regions are anchored by industries with low AI substitutability, including manufacturing, local services, and roles that are primarily physical or manual.
| Area | % Loss | Rank |
|---|---|---|
| San Jose-Sunnyvale-Santa Clara, CA | 0.099 | 1 |
| Washington-Arlington-Alexandria, DC-VA-MD-WV | 0.0907 | 2 |
| Boulder, CO | 0.0904 | 3 |
| Durham-Chapel Hill, NC | 0.0894 | 4 |
| Lexington Park, MD | 0.085 | 5 |
| San Francisco-Oakland-Fremont, CA | 0.0848 | 6 |
| Trenton-Princeton, NJ | 0.0838 | 7 |
| Tallahassee, FL | 0.0801 | 8 |
| Olympia-Lacey-Tumwater, WA | 0.08 | 9 |
| Seattle-Tacoma-Bellevue, WA | 0.0798 | 10 |
| Austin-Round Rock-San Marcos, TX | 0.0788 | 11 |
| Boston-Cambridge-Newton, MA-NH | 0.0785 | 12 |
| Ann Arbor, MI | 0.0766 | 13 |
| Raleigh-Cary, NC | 0.0765 | 14 |
| Denver-Aurora-Centennial, CO | 0.0761 | 15 |
| Bloomington, IL | 0.0758 | 16 |
| Huntsville, AL | 0.0751 | 17 |
| Salt Lake City-Murray, UT | 0.0735 | 18 |
| Provo-Orem-Lehi, UT | 0.0733 | 19 |
| Madison, WI | 0.0725 | 20 |
| Area | % Loss | Rank |
|---|---|---|
| Anniston-Oxford, AL | 0.0368 | 511 |
| Houma-Bayou Cane-Thibodaux, LA | 0.0366 | 512 |
| West Arkansas nonmetropolitan area | 0.0365 | 513 |
| Northeast Louisiana nonmetropolitan area | 0.0365 | 514 |
| Yakima, WA | 0.0364 | 515 |
| Lake Charles, LA | 0.0364 | 516 |
| East Arkansas nonmetropolitan area | 0.0362 | 517 |
| Vineland, NJ | 0.036 | 518 |
| Southwest Alabama nonmetropolitan area | 0.036 | 519 |
| Puerto Rico nonmetropolitan area | 0.0357 | 520 |
| Hanford-Corcoran, CA | 0.0354 | 521 |
| East Tennessee nonmetropolitan area | 0.0354 | 522 |
| Visalia, CA | 0.0353 | 523 |
| Gadsden, AL | 0.0352 | 524 |
| Elkhart-Goshen, IN | 0.0349 | 525 |
| West North Dakota nonmetropolitan area | 0.0342 | 526 |
| Guayama, PR | 0.0341 | 527 |
| Eagle Pass, TX | 0.0336 | 528 |
| Northeast Alabama nonmetropolitan area | 0.0329 | 529 |
| Northwest Alabama nonmetropolitan area | 0.0316 | 530 |
| Areas | Net Loss | Rank |
|---|---|---|
| New York-Newark-Jersey City, NY-NJ | 631934 | 1 |
| Los Angeles-Long Beach-Anaheim, CA | 381388 | 2 |
| Washington-Arlington-Alexandria, DC-VA-MD-WV | 276160 | 3 |
| Chicago-Naperville-Elgin, IL-IN | 269787 | 4 |
| Dallas-Fort Worth-Arlington, TX | 263719 | 5 |
| Boston-Cambridge-Newton, MA-NH | 207019 | 6 |
| San Francisco-Oakland-Fremont, CA | 196056 | 7 |
| Atlanta-Sandy Springs-Roswell, GA | 181395 | 8 |
| Houston-Pasadena-The Woodlands, TX | 178555 | 9 |
| Philadelphia-Camden-Wilmington, PA-NJ-DE-MD | 176304 | 10 |
| Miami-Fort Lauderdale-West Palm Beach, FL | 165902 | 11 |
| Seattle-Tacoma-Bellevue, WA | 161438 | 12 |
| Phoenix-Mesa-Chandler, AZ | 146219 | 13 |
| Minneapolis-St. Paul-Bloomington, MN-WI | 129815 | 14 |
| Denver-Aurora-Centennial, CO | 116690 | 15 |
| Detroit-Warren-Dearborn, MI | 112516 | 16 |
| San Jose-Sunnyvale-Santa Clara, CA | 104664 | 17 |
| Austin-Round Rock-San Marcos, TX | 96031 | 18 |
| San Diego-Chula Vista-Carlsbad, CA | 94104 | 19 |
| Tampa-St. Petersburg-Clearwater, FL | 93125 | 20 |
| Areas | Net Loss | Rank |
|---|---|---|
| Hot Springs, AR | 1266 | 511 |
| Elmira, NY | 1263 | 512 |
| Grand Island, NE | 1249 | 513 |
| Arecibo, PR | 1248 | 514 |
| Bay City, MI | 1165 | 515 |
| Weirton-Steubenville, WV-OH | 1137 | 516 |
| Minot, ND | 1107 | 517 |
| Homosassa Springs, FL | 1101 | 518 |
| Gettysburg, PA | 1033 | 519 |
| Kokomo, IN | 991 | 520 |
| Lewiston, ID-WA | 986 | 521 |
| Sebring, FL | 978 | 522 |
| Gadsden, AL | 942 | 523 |
| Grants Pass, OR | 908 | 524 |
| Puerto Rico nonmetropolitan area | 890 | 525 |
| Walla Walla, WA | 835 | 526 |
| Enid, OK | 699 | 527 |
| Hinesville, GA | 650 | 528 |
| Eagle Pass, TX | 455 | 529 |
| Guayama, PR | 264 | 530 |
Sources: Digital Planet, The Fletcher School, Tufts University; Anthropic Economic Index (2025); Tomlinson et al. (2025)

Sources: Anthropic Economic Index (2025); Tomlinson et al. (2025); Digital Planet, The Fletcher School, Tufts University
Based on our estimates, New York City, Los Angeles, Washington D.C., San Francisco, Chicago, Dallas, Boston, Seattle, San Jose, Atlanta, Philadelphia, Houston, Miami, Minneapolis, Phoenix, and Denver are projected to lose between $10 billion and $70 billion each in annual household income, with a combined loss of roughly $757 billion across the country. While AI-driven productivity and efficiency gains are likely to increase local GDP and tax revenues, boosting company earnings and generating cost savings for firms and shareholders, the direct impact on households will be significant. For example, New York City alone is projected to lose more than 600,000 jobs of the approximately 9 million jobs considered in this analysis.
Massachusetts, New York, Maryland, Colorado and Virginia – alongside the District of Columbia emerge as the five most exposed US States to Artificial Intelligence. By contrast, California, Texas, New York, Florida, and Illinois are projected to experience the largest absolute job and income losses. Notably, at the time of writing, many of the most affected states also have the highest volumes of AI-related legislation either passed or proposed. An exception is the District of Columbia, which ranks among the most exposed jurisdictions but lacks any major legislation or executive orders, reflecting its unique status as a federally governed district rather than a state. In December 2025, the White House issued an Executive Order preempting state-level AI legislation, and threatened to withhold BEAD funding for states that pass AI legislation. While states grapple with how to respond legislatively, the scale of the challenge they face is substantial.
Under our median scenario, we estimate that approximately 9.3 million of the 151 million jobs analyzed would be at risk in the near term across all 50 states and three U.S. territories. When we expand our view to capture slower and faster adoption curves, the projected range spans between 2.7 million to 19.5 million jobs.
The estimated income at risk ranges from $200 billion to $1.5 trillion annually, with a midpoint estimate of approximately $757 billion. Relative to roughly $10 trillion in total annual household income, this implies that AI-driven job displacement could reduce household income by about 2 to 15 percent across the U.S. workforce.

Sources: Anthropic Economic Index (2025); Tomlinson et al. (2025); The State of State Digital Transformation – Digital Government Hub (2025); Digital Planet, The Fletcher School, Tufts University.
Click here to view the other metrics on the Appendix.
AI’s effects on U.S. employment are uneven but economically significant, with meaningful implications for workers, regions, and policymakers. While overall industry vulnerability remains around 6 percent, risks are sharply concentrated in Information, Finance and Insurance, and Professional Services, and in major metropolitan labor markets such as New York, Los Angeles, Washington, D.C., Chicago, Dallas, Boston, San Francisco, and Atlanta. High-skill, knowledge-intensive occupations simultaneously exhibit strong potential for productivity gains and elevated displacement risk, underscoring that AI adoption is likely to deliver efficiency benefits alongside substantial labor market disruption.
Geographic patterns further reinforce these dynamics. At the state and jurisdiction level, the District of Columbia, Virginia, Massachusetts, Washington, Maryland, Colorado, and New York face the highest risk of losing a larger share of jobs to AI. Our projections are broadly consistent with Goldman Sachs’ baseline estimates, which suggest job displacement of approximately 6–7 percent, with a wider range of 3–14 percent under alternative assumptions. Under our median adoption scenario, approximately 9.3 million jobs are at risk of replacement, with a plausible range of 2.7 to 19.5 million. The associated household income at risk is estimated between $200 billion and $1.5 trillion annually, with a midpoint of roughly $757 billion—highlighting the scale of potential redistribution and adjustment pressures facing U.S. households.
| Rank | Occupation | Percent Job Loss |
|---|
| Rank | Occupation | Percent Job Loss |
|---|
Sources: Digital Planet, The Fletcher School, Tufts University, Anthropic Economic Index (2025); Tomlinson et al. (2025)
Click here to view the other metrics on the Appendix.
There are several implications for policymakers, political actors, technologists and business. They include:
Modernize the Safety Net to Reflect AI-Driven Labor Market Disruption: Current unemployment systems were designed for an economy with more stable employer-employee relationships. As AI accelerates displacement and the shift toward non-traditional work, three targeted reforms can help the safety net keep pace: (1) Expand unemployment insurance eligibility to cover gig, contract, and part-time workers most exposed to automation — California’s AB 5 and portable benefits pilots in New York and Washington offer early frameworks. (2) Introduce wage insurance for workers re-employed at lower wages following AI-related displacement, building on the Trade Adjustment Assistance model. (3) Expand the Earned Income Tax Credit to support workers whose hours or wages are reduced by automation.
Standardize AI Use Through Clear, Centralized Definitions: Deliberate on a centralized definition of AI that can be generalized across industries, concentrating on functional applications and transparency in acceptable use cases, as reflected in the EU’s Platform Work Directive.
Create a Unified AI Labor Market Measurement Initiative and Require Companies to Disclose AI Workforce Data: This can help to create the evidentiary foundation that the policy debate desperately lacks. Greater transparency would allow policymakers and researchers to better understand how AI adoption is reshaping labor markets and where targeted interventions may be needed. With adequate resources, there are two key data-gathering opportunities: (1) the Bureau of Labor Statistics (BLS) could systematically track the direct impact of artificial intelligence on employment. This initiative would integrate AI specific questions into existing surveys such as the Current Population Survey and employer surveys to measure AI adoption, task automation versus augmentation, and resulting changes in wages, hours, and job responsibilities. (2) Require publicly-traded companies and public sector agencies to submit detailed reporting on job loss, new hiring, reduced hiring, and other labor changes stemming from AI. Congress should move forward on the bipartisan bill proposing just that.
By embedding AI metrics into its core statistical frameworks, the government can provide policymakers with timely and reliable evidence on how AI is reshaping the labor market.
Link AI Adoption Incentives to Worker Reskilling and Job Protection: Akin to legislation in Missouri (H.B. 417) and Minnesota (Minnesota Automation Training Incentive Program), subsidize “recredentialing” and training grants for private businesses incorporating AI automation into their workflows. This would be contingent on providing reskilling/upskilling opportunities to workers in high-exposure positions and protecting their employment status for an allotted period during the training period. Establish viable benchmarks for participation in these programs by building upon the principles of Denmark’s AI Competence Pact, tailored to the needs of individual states.
Create State-Led AI Workforce and Risk Assessment Bodies: Commission state-level “AI Workforce Transformation Groups” with a two-pronged mandate: assess different industries’ exposure to automation, and develop common language surrounding high-risk, medium-risk, and low-risk AI applications (consider Idaho’s framework as a foundation), concentrating on the percentage of tasks that require human oversight (to measure exposure) and the type of data being processed (to measure risk). Similarly, streamline Generative AI training processes within state administrations, in line with Finland’s national push towards AI literacy among public administrations via “eGovernment.”
Push for Regulation and Policy Safeguards at a State and Local Level: States and municipalities face an increasingly hostile federal environment for AI regulation — and cannot afford to wait. In December 2025, President Trump signed an executive order directing the Justice Department to challenge state AI laws and threatening to condition federal funding on states’ compliance with the administration’s deregulatory posture. Even so, states should press forward with worker protections and transparency requirements that reflect the realities of AI-driven labor market disruption. Cities, meanwhile, can lead on procurement: San José’s GovAI Coalition — a partnership of over 150 local, county, and state agencies — has pioneered shared frameworks requiring vendors to disclose how their AI systems work and meet baseline accountability standards before any public contract is signed. The administration’s pressure campaign is itself an argument for urgency: each state and city that acts builds the political record that will shape the eventual federal framework.
Build State AI Talent Pipelines and Reimagine Education for Lifelong Learning: One of the central challenges of AI-driven disruption is that the technology evolves far faster than traditional education systems can adapt — curricula lag behind industry needs almost by definition. Technologists are uniquely positioned to help narrow this gap. Drawing inspiration from the India AI Future Skills Platform, technologists should partner with K-12 districts, community colleges, and state-funded universities to embed AI literacy across subjects and develop industry-specific training modules for high-exposure fields. Career pathways from these programs should feed directly into private-sector roles and state-level positions within the aforementioned AI Workforce Transformation Groups. Critically, this cannot be a one-time curricular update — technologists should co-design short-cycle, stackable credentials that can evolve as AI capabilities shift, building the lifelong learning infrastructure that workers will need long after leaving school. Ohio’s community college grant program, the Wyoming Innovation Partnership, Denmark’s AI Competence Pact, and the EU’s Upskilling Pathways initiative all offer useful models to build from.
Track and Publish Data on AI’s Workforce Impact and How Workers are Using AI: AI companies already collect detailed data on how their tools are used across industries, occupations, and task types. Responsible companies should publish this data to give analysts and policymakers clear, timely visibility into how AI adoption is evolving, and where the workforce impacts are being felt.
Embed Human Oversight and Responsible AI Principles into Company Culture and Processes: Businesses should approach AI deployment as augmentation first, not replacement — treating it as an opportunity to redesign work rather than simply reduce headcount. In practice, this means conducting task-level impact reviews before deployment to target automation toward routine, repetitive tasks while preserving human judgment in consequential decisions. It also means communicating early and transparently with employees about how AI will affect their roles, funding targeted reskilling and internal mobility pathways so workers can transition into new functions, and establishing cross-functional AI governance structures — spanning HR, legal, and operations — to ensure deployment decisions are made deliberately and accountability is clear. Businesses deploying AI in workforce contexts should also ensure that decisions directly affecting workers (hiring, scheduling, performance evaluation) retain meaningful human review, and that tools are tested for bias and disparate impact before rollout. Industry bodies like the Partnership on AI and the NIST AI Risk Management Framework offer practical starting points for operationalizing these principles.
Identify At-Risk Roles and Invest in Retraining and Internal Mobility: Companies should systematically identify the roles and occupations within their own workforce most exposed to automation, and fund targeted retraining, credentials, and internal mobility pathways to help those workers transition into new functions rather than out of the company entirely.
Partner with Local Governments and Educational Institutions to Support At-Risk Communities: The costs of AI-driven displacement are not distributed evenly — some metros and industries will bear a disproportionate share. Companies should partner with local governments and educational institutions in the most affected communities to co-invest in jobs transition programs, putting private resources behind the workers and places bearing the highest costs of automation.
Monitor and Expose AI’s Workforce Impact: Civil society organizations are uniquely positioned to fill the data gaps that neither government nor industry has adequately addressed. This means conducting independent monitoring of AI-driven job displacement, funding investigative research and media investigations into where and how automation is reshaping work, and advocating loudly for mandated corporate reporting on AI-related workforce changes. The public debate will remain clouded by motivated reasoning until credible, independent actors take ownership of the evidentiary record.
Build Networks for Shared Learning for State and Local Actors: The policy response to AI displacement will be uneven — some states and cities will move faster and smarter than others. Civil society organizations should create structured mechanisms for metros and states to learn from one another, surfacing what is working, accelerating adoption of effective models, and ensuring that less-resourced communities are not left to reinvent the wheel alone.
Connect Economic Impact to Political Action: Displacement without political voice is invisible. Civil society leaders should work to connect AI-driven economic disruption to organized political action — ensuring that affected workers and communities have representation in the policy conversations that will shape the federal and state response.
Advocate for Targeted Reskilling and Education Reform: The dominant narrative around reskilling tends toward the generic — workforce development broadly conceived, for an economy broadly disrupted. Civil society organizations should push back on that framing, amplifying evidence that effective reskilling programs are designed for specific occupations and targeted roles, not entire workforces. Governors and mayors of the most affected communities should be made aware of their communities’ specific risk profiles and held accountable for responding to them. Alongside this, civil society should advocate for education reform that prepares the next generation for an AI-shaped labor market — not just in technical skills, but in adaptability, critical thinking, and the human capacities that automation is least likely to replace.
This report provides a forward-looking assessment of AI’s potential impact on employment using a structured and analytically consistent framework. Its purpose is to support pre-emptive action — to give policymakers, businesses, and workers a clear-eyed picture of what is coming before it fully arrives, rather than scrambling to respond after the fact. The Index focuses on exposure to displacement and labor market disruption and does not incorporate job creation effects, given the current lack of sufficiently robust and observable data in that area.
That said, several important caveats apply. AI capabilities and adoption are evolving rapidly, and projected impacts will shift as the technology, regulatory environment, and firm strategies change. Labor market effects may also follow a J-curve pattern — organizations typically must first invest in upgrading legacy systems, retraining workforces, and building the complementary infrastructure that makes AI deployment viable before measurable workforce adjustments occur. This means the timeline of disruption may be uneven: slower in the near term, then sharper as adoption matures. Beyond technology, employment outcomes are shaped by human psychology, managerial decisions, capital market pressures, and a political environment that is itself in flux. Regulatory and legal constraints — including occupational licensing requirements that shield certain roles from automation regardless of technical feasibility, as in the case of radiologists — and union and worker bargaining power will also mediate how and where displacement actually occurs.
The findings should therefore be interpreted as scenario-based rather than deterministic — a structured view of plausible futures, not a forecast. The Index will be updated as new data emerges on AI adoption, realized labor market impacts, and the broader systemic adjustments that will inevitably follow.
The TB and SML scores measure exposure at the DWA level, while the AAI score reflects broader historical AI progress. Scores are aggregated to the occupational level and combined using principal component analysis (PCA) to determine objective weights based on shared variance:
Occupational exposure scores are calculated as weighted sums of available components and normalized to account for missing scores. Occupations with no available exposure data are excluded from subsequent calculations.
Geographic exposure scores (metropolitan, nonmetropolitan, state, and territory) are computed as employment-weighted averages of occupational exposure scores using OEWS employment counts.
Claude task-level automation scores are aggregated to IWAs, while Copilot automation scores are derived by multiplying IWA prevalence, success, and scope, taking the minimum of user- and AI-goal scores. All scores are normalized and combined into a single IWA-level automation metric.
Task-Level Automation Projection
Using ONET 30.0 task data and National Employment Matrix (NEM) employment data:
Tasks are weighted by annual frequency and relevance.
Each task is assigned an automation score based on its associated IWA. This score is rescaled into an estimate of a task’s current automation level.
Future task automation is assumed to follow a logistic growth trajectory; we project future automation levels by advancing all tasks by a fixed distance along the same growth curve. Our baseline scenario reflects an intermediate choice of distance parameter. (See detailed methodology, linked below, for details.)
Expertise and Task Reweighting
Task expertise is estimated by embedding ONET task statements into a semantic vector space and regressing them onto ONET Job Zone scores.
For each occupation, two changes are computed:
The change in the occupation’s expertise level, taken as the weighted average of the expertise levels among its tasks.
The change in total task quantity (sum of all task weights).
Conceptually, the change in expertise level acts as a shift in labor supply, with the number of qualified people changing in inverse proportion to the level of expertise required. The change in task quantity acts as a shift in demand.
Mathematically, Autor and Thompson (2025) found a function of best fit from these changes to changes in employment over recent decades, which we use to make our own projections.
Physicality Adjustments
Predicted job losses are adjusted downward for occupations requiring physical activity, using five ONET indicators (four Work Activities and one Work Context). These are combined into a physicality coefficient, which scales job loss predictions into four protection tiers.
Legislators’ predicted job loss is set to zero due to non-market employment dynamics.
Using OEWS employment and wage data:
Net job loss is calculated as predicted job loss × employment.
Income loss is estimated using median wages, reflecting impacts on typical workers.
Aggregated job and income losses are computed for metropolitan/nonmetropolitan areas, states, territories, and industries using pivot tables.
Percent job loss, percent income loss, and an income-to-loss ratio are calculated to assess whether losses are concentrated in higher- or lower-paying occupations.
Find the methodology here and the data here.
This study was conducted by Bhaskar Chakravorti, Christina Filipovic, and Abidemi Adisa. Graduate Student Analysts Max Agigian, Turan Tashkin and Utsav Subramani worked on this analysis under their guidance. Graduate Student Analysts Elise Torche, Mitakshi Lakhani, Veeradittya Podder, and Shubhangi Thakur contributed to this research.


