Key Findings
-
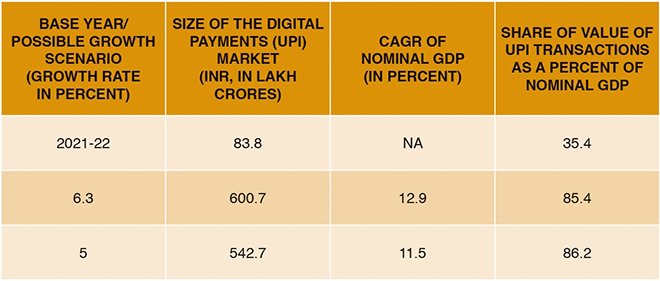
- In 2030-31, the values of UPI transactions will be INR 542.7 trillion if real GDP growth is 5% (a below-average figure), and INR 600.7 trillion if the real GDP growth is 6.3% (average growth rate as estimated across various studies). This is considering 2021-22 as the base year.
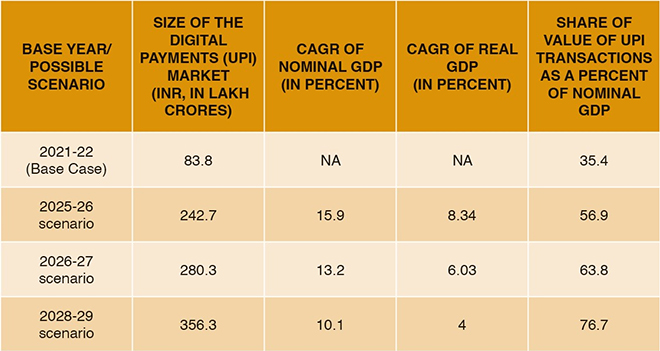
- If India achieves USD 5 trillion-dollar GDP during 2025-26, 2026-27, and 2027-28, the sizes of the UPI markets will be INR 242.7 trillion, INR 280.3 trillion and INR 356.3 trillion, respectively.
- Financial inclusion, adoption of network infrastructure and income are found to be positive and statistically significant factors affecting UPI payments.
- While the increase in income has boosted digital transactions, developmental parameters like digital literacy and digital inclusion have not affected the size of digital payments markets in a statistically significant manner.
UPI Market Size Under US$5T-Economy Scenarios
UPI Market Size Under Possible Growth Scenarios till 2030-31

1. Introduction
There is growing consensus that digital payments can facilitate financial transactions and help boost economic growth in both developed and emerging market economies (EMEs).[1],[2] Indeed, the COVID-19 pandemic demonstrated how the digitisation of payment mechanisms enabled EMEs to hurdle the disproportionate challenges that faced the developing world during the health emergency.[3],[4] The geometric rise in digital transactions in EMEs in recent years was a result of multiple factors, among them the resolve of governments to create cashless societies, tech innovation, the affinity of the youth cohorts for technology adoption, the inclusiveness of the fintech boom, and enhanced digital infrastructure leading to more merchants conducting digital financial transactions. According to Global Data Research, the proportion of cash in total transactions volume declined globally from 90 percent in 2017 to less than 60 percent in 2021.[5]
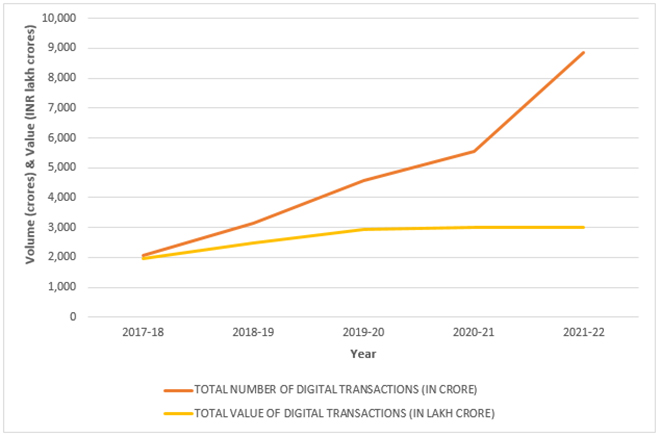
India accounts for a sizeable proportion of the global increase in digital payments and outperforms the rest of the world in terms of its share of total real-time digital payments.[6] The volume of digital transactions in India in 2021-22 was four times that in 2018-19.[7] The demonetisation campaign in 2016 began a new chapter in the digitalisation story of the country’s payments systems, and the COVID-19 pandemic added momentum to the growth.[8]
Table 1: Total Number and Value of Digital Transactions in India (2017-18 to 2021-22)
| Financial Year |
Total Number of Digital Transactions (in billions) |
Total Value of Digital Transactions (trillion INR) |
| 2017-18 |
20.71 |
1,962 |
| 2018-19 |
31.34 |
2,482 |
| 2019-20 |
45.72 |
2,953 |
| 2020-21 |
55.54 |
3,000 |
| 2021-22 |
88.40 |
3,021 |
Source: RBI, NPCI and Banks as cited in https://www.meity.gov.in/digidhan
Figure 1: Digital Transactions in India, in Volume and Value
Today, the United Payments Interface (UPI) mechanism has become an increasingly preferred alternative to the use of cash in the country[10] and is expanding in depth and breadth.[a] The growth is observed in both the volume and value of transactions which increased, respectively, by 115 percent and 121 percent between 2019 and 2022.[11] UPI registered a significant leap in its share of total digital transactions from 17 percent in 2018-19 to 52 percent in 2021-2022.[12]
The expansion of the digital ecosystem[13] and its increasing sophistication has been facilitated by government initiatives for greater digitalisation,[14] the rapid uptake of internet network infrastructure and digital devices, increased consumer awareness,[15] robust payments infrastructure, rising number of mobile wallets,[16] and the booming e-commerce industry.[17] Ease of use, and the speed and transparency of digital transactions[18] are also encouraging the shift to digital mode.
Government initiatives such as Digital India, Make in India, and Startup India have all ramped up the adoption of digital transactions by leveraging digital technologies in strengthening health, education and agriculture as well as developing the start-up ecosystem.[19] The Jan Dhan-Aadhaar-Mobile trinity has propelled the growth of digital transactions.[20] The establishment of the National Payments Council of India has been instrumental in facilitating better outcomes for digital payments.[21] The launch of the Pradhan Mantri Jan-Dhan Yojana (PMJDY), recognised as the largest global financial inclusion programme, has made progress in reaching its goal of universal banking.[22]
The Reserve Bank of India launched its Digital Payments Index in 2018 to track the progress made in the extent and degree of digitalisation of India’s payments system.[23] The measurement relies on five parameters: Payment Enablers, Payment Infrastructure (Demand-side factors), Payment Infrastructure (Supply-side factors), Payment Performance, and Consumer Centricity. Figure 2 summarises the results of the measurement exercise.[24]
Fig 2: Digital Payments Index in India
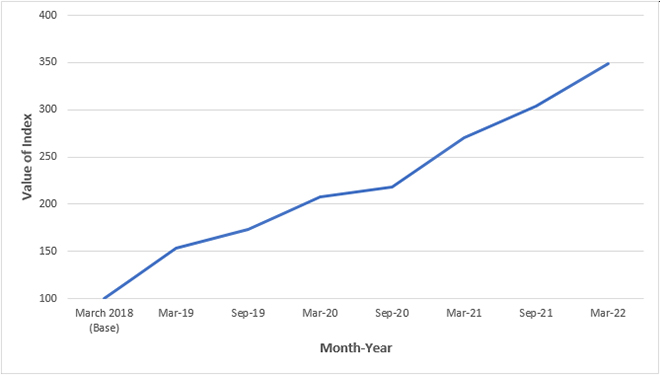
Source: Computed by the authors with data from RBI press release[25]
With March 2018 as the base, the rising trend reflects the enormous growth in digital payments. While India has recorded a significant increase in digital transactions, cash is still the dominant payment mechanism, with cash usage accounting for 59.3 percent of transactions volume in 2021.[26]
India’s transition to a cashless economy would require steering the process of digital growth in the right direction by adjusting the relevant parameters.[b]
So far, UPI transactions are growing in remarkable terms—Figure 3 shows the rise between April 2018 and May 2023. The growth is driven by the increase in the number of banks live on UPI from 97 in April 2018 to 447 in May 2023, or a 360-percent increase. The volume of UPI transactions in the same period increased by 4,800 percent; and the value, by 5,400 percent.
Fig. 3. Growth of UPI in India (April 2018-May 2023)
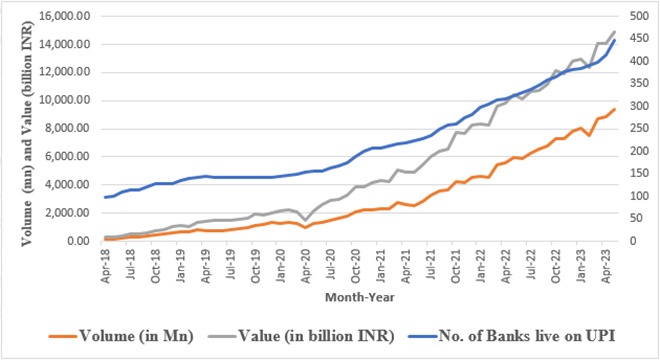
Source: Computed by the authors with data from UPI Product Statistics on the NPCI website[27]
Overall, the growth of digital transactions in India has relied on fast-growing digital infrastructure, UPI-led adoption of digital payments, pandemic-induced changes in consumers’ tastes and preferences, rapidly expanding merchant acceptance infrastructure (implying the rapid increase in the numbers of merchants accepting cashless payments), and disruptive technological innovations in the digital payment ecosystem driven by the big techs and the fintechs.[28] In this backdrop of the notable growth of digital transactions and, more specifically, UPI transactions, this paper seeks to hypothesise the size of the UPI payment market under various GDP growth scenarios.
This paper estimates the various sizes of the UPI market by accounting for the various future growth trajectories of the Indian economy. This provides inputs for decision-making and policy formulation. The paper posits that if India’s current momentum in ‘consumption-driven growth’[29] continues, the UPI market will expand under the assumed growth scenarios. This is more so because it is assumed that UPI caters to the consumption demand of the economy, rather than investment or other forms of demand.
India is aiming to reach the US$5-trillion GDP mark by the middle of this decade.[30] Various growth estimates suggest a number of timelines for achieving this ambition. This paper considers three of those timelines and growth rates, and treats them as scenarios. Two more growth scenarios are taken in the form of the following: (a) average growth rate of 6.3 percent that may prevail till 2030 as forecasted by S&P;[31] and (b) a below-average mark.[c] This paper estimates the UPI market size under all these probable growth scenarios by modelling the digital transactions using a parametric method. Section 2 reviews the existing literature on digital payments, in general, and in particular, India’s UPI, and identifies the knowledge gaps that this paper seeks to fill. Section 3 outlines the structural equations of the econometric model, and Section 4 then estimates the model. The fifth section undertakes a scenario analysis based on the model, the sixth outlines a plausible action plan for India, and the paper concludes with Section 7.
2. Literature Review
The discourse around digital transactions has generated a number of studies on the issues, concerns, opportunities and challenges involving digitalisation of the payments system at the global level. A 2016 study published by PwC elaborates on how emerging markets have been and will continue to be at the forefront of digitalisation of payments.[32] The study attributed the growth of digital payments to an expanding online payments ecosystem anchored in the evolution of technology, shifts in tastes and preferences as well as demographic features of the consumer base, the booming e-commerce, and the strengthening impact of regulatory interventions. In the same year, a report published by McKinsey Global Institute[33] estimated the social and economic effects of migrating to the use of digital finance across seven emerging economies—i.e., Brazil, China, Ethiopia, India, Mexico, Nigeria, and Pakistan. According to the study, large-scale deployment of digital finance could result in a six-percent (US$ 3.7 trillion) increase in the combined GDP of all emerging economies accompanied by the generation of 95 million employment opportunities by 2025.
For India, Singh at al. (2019)[34] identified certain critical factors for the digital payments system to succeed. These include positive perceptions about ease of use and functional advantages; expectations about technology’s performance; consumer awareness; availability of resources required for ownership and use of technology; price of such resources and services availed by the user of the technology; past experience with technology and associated habits; ability to take risk; the efficacy of government as policymaker; and ability of the user to influence others to adopt and use the technology.
For their part, Rastogi and Damle (2020)[35] found that the adoption of digital payments was driven by increased penetration of mobile phones, widespread use of the internet, and rise in bank accounts. The study further highlighted the role played by the COVID-19 pandemic and demonetisation in the uptake of digital payments. Shree et al. (2021)[36] employed a novel approach of generating an online survey-based dataset to gauge the influence of ‘perception’ and ‘trust’, and of the past experience of cyber fraud on the adoption and usage of digital payments. They concluded that demographic parameters such as age, education, income and gender influence digital payments adoption and use. Mani and Iyer (2022)[37] identified three building blocks that determine the diffusion of digital payments: actors and institutions; technology (or knowledge) representing supply-side factors; and demand for digital payments. Bhavsar and Samanta (2022),[38] meanwhile, applied an autoregressive distributed lag model (ARDL) bounds test to cointegration along with Dynamic ordinary least square method (DOLS) for evaluating the sustainability of digital payments in India. The study found that sustainability of digital payments in India relies on national income and financial literacy.
According to a 2023 study by the Bank for International Settlements’ Committee on Payments and Market Infrastructures, the total value and volume of digital transactions in the post-pandemic years was driven primarily by the widespread adoption of card payments. However, acknowledging the sizeable demand for cash, the paper hints at the need for a proposed Central Bank Digital Currency (CDBC) to be cognisant of this demand for cash.[39] A recent report by PhonePe Pulse and Boston Consulting Group states that while future growth in digital transactions will be driven by further expansion of payments infrastructure and merchant acceptance network, digital transformation of value chains, and development of financial services marketplace, there is a need for consistent efforts towards developing consumer confidence through stringent cybersecurity measures, simplifying onboarding and KYC procedures, ensuring economic viability and profitability of the business of payments provision, relieving the pressure on the banking system, and strengthening the national digital infrastructure.[40] Lately, an analysis of the RBI data on electronic payments finds that UPI outperforms the others both in terms of uptake and usage[41]
Studies on GDP and Digital Payments
There are several studies that have scrutinised how the increase in digital payments positively affects economic growthZandi et al. (2016)[42] investigated this relationship for 70 countries from 2011 to 2015. They found that a one-percent increase in adoption of digital payments increases consumption by US$104 billion and GDP growth by 0.04 percent. It also observes a greater impact of digital payments on economic growth is greater for developing countries. Tee and Ong (2016),[43] analysing the relationship in the context of the European economy, found evidence of long-turn impacts of cashless payments on the GDP, while such impacts are not significant in the short-run. For their part, Lau et al. (2020)[44] developed a model to capture the interaction between digital payments and economic growth which transmits the positive influence of the former on the latter. This model identifies three transmission channels for boosting GDP growth: increases in household consumption, investment expenditure, and government expenditure.
According to Ravikumar et al. (2019),[45] digital payments have significant impacts on real GDP in India in the short run, but the same trend is not expected in the long run. However, in contrast to this result, using panel data cointegration, Sreenu (2020)[46] found a significant impact of digital payments on economic growth in the long run in India rather the short run.
Pang, Ng and Lau (2022),[47] meanwhile, evaluated the relationship between digital payments and economic growth in the 27 member countries of the Committee on Payments and Market Infrastructures (CPMI).[d] The study provided a comparative assessment of this relationship between developed and developing countries under investigation. On the basis of fixed effects panel model, though the study found a positive relationship between economic growth and all three modes of digital payments (debit cards, credit cards and e-money payments), the causality is statistically significant only in the case of e-money payments. The study also found that the effects of digital payments on economic growth is stronger in case of developed economies rather than developing countries. The paper recommended the implementation of measures that ensure stringent cybersecurity, increasing awareness about digital payments for greater adoption, and encouraging merchants to accept digital payments from customers.
As we note here, literature has essentially looked at the impact of digital markets on GDP. However, the reverse causality seems logically applicable. This becomes even more enforcing for UPI payments for three reasons. First, UPI largely affects consumption expenditure. Second, for a consumption-driven economy like India, there is enough evidence that with GDP rise, UPI payments have increased. Third, in terms of the classic Keynesian consumption function models, consumption is treated as a dependent variable driven by disposable income (with GDP as its best proxy).[48] However, an empirical testing of this causal relationship is conspicuous by its absence in the existing strands of literature on GDP and digital payments, and UPI payments to be more specific.
Digital Intelligence Index and India
The 2020 iteration of the Digital Intelligence Index published by the Fletcher School at Tufts University[49] is a comprehensive index based on 358 indicators classified into two categories: digital evolution and digital trust. ‘Digital evolution’ is defined by four pillars: Supply Conditions, Demand Conditions, Institutional Environment, and Innovation and Change. Based on these pillars, the Digital Evolution scorecard generates insights about the state and the rate of digital evolution (defined as the growth of digitalisation over the time period 2008-2019) in 90 economies. The analysis based on this scorecard classifies economies into four categories:[50]
- Stand Out: High level of digital development, strong momentum of digital development
- Stall Out: High level of digital development, weak momentum of digital development
- Break Out: Low level of digital development, strong momentum of digital development
- Watch Out: Low level of digital development, weak momentum of digital development
India is classified as a Break Out economy in the 2020 Index: 61st on the state of digital evolution and 4th on its momentum. The report suggests that there is substantial scope for further accelerating India’s momentum of digital development by improving its performance on factors that influence the demand conditions prevalent in the digital ecosystem. The report identifies these factors and offers insights on the mechanisms that define the growth of digital transactions in India.
Gaps in Existing Literature
As stated earlier, there is a dearth in research on UPI payments as a function of GDP. Quite evidently, there is no analysis that has looked at future scenarios of digital markets on the basis of GDP growth. This creates an important entry point to the present paper. This paper therefore attempts to create scenarios on the basis of various GDP growth trajectories through an econometric modelling framework, on the basis of the theoretical underpinning provided by the Keynesian consumption function. In the process, there are two chasms that this paper attempts to bridge. First, it attempts to address questions that still remain unanswered in the literature: What are the impacts of economic growth on the size of UPI payments? Given the same, what will be the sizes of the UPI markets under various GDP growth scenarios? Second, it presents a pioneering methodological framework that may be replicable in future studies that attempt to respond to similar questions.
3. The Framework
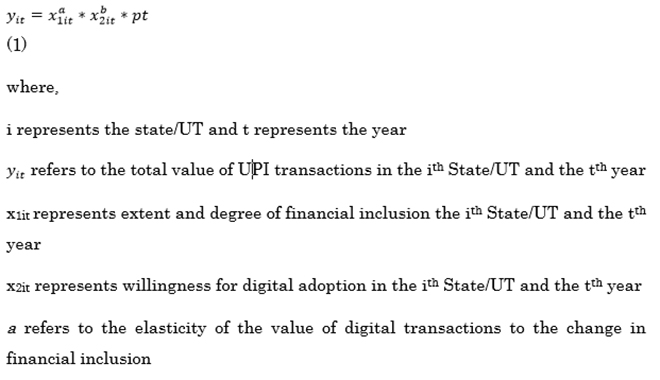
Globally, the growth in digital transactions is attributed to the progress made in terms of human development, financial inclusion, digital inclusion, internet connectivity, and ownership of digital devices.[51] This paper seeks to model the behaviour of digital transactions in India by quantifying the contribution of each of these factors to the increase in digital transactions. Since these factors represent the demand-side forces of the digital market, the statistical exercise conducted by these authors quantifies the interaction between demand for digital transactions and their growth. The equation in (1), below, suggests that the growth in digital transactions is explained by financial inclusion in the form of ownership and use of bank accounts, and also by digital connectivity. This follows axiomatically from the fact that bank accounts and internet connection are necessary for digital transactions. The parameters ‘a’ and ‘b’ represent, respectively, the rates at which increases in financial inclusion and internet connection translate to a rise in mobile banking.
(1)
Financial inclusion and digital connectivity are decomposed into variables that represent the ability and willingness to demand digital transactions. These variables are income, digital literacy, and digital inclusion. Digital connectivity is intended to be a proxy for capturing the impact of factors that determine the willingness for digital adoption. Some of those factors are e-commerce, the state of network infrastructure, the ownership of smartphones, and the safety and security of internet use.
p refers to the cumulative impact of factors occurring at time t and common to all cross-section units
b refers to the elasticity of the value of digital transactions to the change in adoption of network infrastructure.
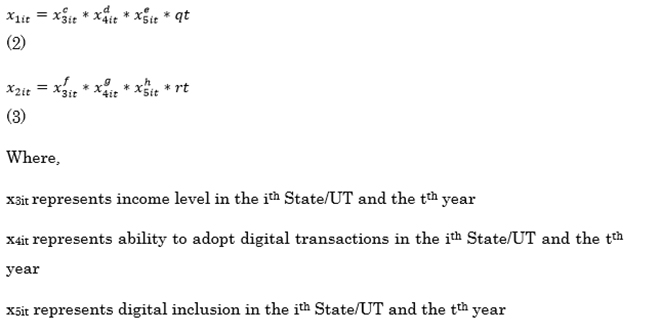
c refers to the elasticity of financial inclusion to the change in residual income effect not accounted for in the behaviour of other variables
d refers to the elasticity of financial inclusion to the change in the ability to adopt digital transactions
e refers to the elasticity of financial inclusion to the change in digital divide
f refers to the elasticity of willingness for digital adoption to the change in residual income effect not accounted for in the behaviour of other variables
g refers to the elasticity of willingness for digital adoption to the change in the ability to adopt digital transactions
h refers to the elasticity of willingness for digital adoption to the change in digital divide
p and q refer to the cumulative impact of factors occurring at time t and common to all cross-section units
Equations (1), (2) and (3) are adaptations of the quintessential Cobb-Douglas production function.[e] In equation 1, financial inclusion and willingness for digital adoption are inputs while the value of digital transactions is the output. In equation 2, digital skills, digital inequality and income are inputs while financial inclusion is the output. In equation 3, digital skills, digital inequality and income are inputs while adoption of network infrastructure is the output. Each equation is augmented by adding a function of time to gauge certain temporal influences on the spatial dynamics of the structure presented above. The inclusion of this variable allows the model to account for the effects of common shocks and factors affecting all cross-sections at a given time and thereby the cross-sectional dependence induced by such effects. Apt examples are the COVID-19 pandemic, the overall state of digital ecosystem and economy, and network effects. The time parameter tames non-stationarity of stochastic processes involved.
4. Estimation of the Model
4.1. Data
The objective of this analysis is to understand the exponential growth exhibited by digital transactions in India in the post-demonetisation era. The demonetisation implemented by the Union Government of India in 2016 compelled a recalibration of the model explaining the growth of digital transactions. The demonetisation therefore represents a structural break in this model. The launch of the UPI in India during demonetisation defines the implications of the structural break mentioned above.
The estimation of this model is based on a panel data set including observations across the time period from 2018-19 to 2021-22 for 32 states/UTs for which consistent data is available. The estimation relies on a short panel, i.e., N>T, where N refers to the number of cross sections and T refers to the number of time units. The primary time unit is a year.
The state-wise data on PhonePE-based UPI transactions is used for the quantification exercise. Since phonePE dominates the market share for UPI transactions with a nearly 50-percent share, it is assumed that trends characterising PhonePE-based UPI transactions are representative of those describing the behaviour of total digital transactions in India. Assuming that the state-wise share of UPI transactions in India mirror that of PhonePE-based UPI transactions, the state-wise total value of UPI transactions is calculated. The quarterly data on PhonePE-based UPI transactions are obtained from the PhonePE website.[52] Annual figures on the state-wise value of UPI transactions are obtained by appropriately aggregating the quarterly data.
The estimation of the income effect on digital transactions in India relies on Net State Domestic Product (NSDP) as a proxy for income. The annual state-wise data for NSDP (at constant 2011-12 prices) is obtained from the website of the Reserve Bank of India (RBI).[53] The missing values of NSDP in 2021-22 assumes that the state-wise share of Net Domestic Product of India for this year mimics those for the previous three years included in this analysis. Indeed, the state-wise shares of NSDP in these three years have been fairly constant. The use of NSDP allows the model to draw attention to the interaction between the real economy and the payments system.
The extent and degree of financial inclusion is represented by the total value of current account and savings account (CASA) deposits across different states in India. Since having a bank account is a prerequisite for digital transactions, the impact of financial inclusion on digital transactions is assumed to be transmitted through the change in CASA deposits. The state-wise annual data on the value of CASA deposits is obtained from the RBI website.[54]
A simple average of the mean years of schooling (MSY) of adults aged 25+ and the expected years of schooling (EYS) by a child of school entrance age is used as a proxy for capturing the level of digital skills and their impact on the behaviour of digital transactions. The subnational data on MSY and ESY is obtained from the website of Global Data Lab (GDL).[55] This variable is one of the many dimensions of human development that affect the uptake of digital transactions. The choice of this variable is based on the assumption of a strong correlation between this variable and digital skills, as studies have found evidence of such link.[56],[57]
The size of wireless mobile internet subscriptions in a state/UT is used as a proxy for the willingness to go digital. The paper acknowledges that this is a rather crude measure of digital adoption. After all, digital payments systems are only one of the many dimensions of digitalisation in a state/UT. This analysis assumes that the factors which positively influence digitalisation also boost the uptake of the internet, at least until the goal of universal adoption and coverage is achieved. This implies a correlation rather than cause-and-effect relationship between internet usage and the progress achieved by digitalisation as a whole. Moreover, since internet subscription is essential for undertaking digital transactions, it is assumed that greater willingness to go digital will reflect in increases in internet subscriptions. The annual subnational data on wireless mobile internet subscribers is obtained from the website of the Telecom Regulatory Authority of India (TRAI).[58] This state-level data is derived from the figures on service areas, assuming that the relationship between the number of subscriptions at the state level and the service area level remains constant throughout the period under consideration.
Income inequality by gender is computed as the difference between the natural logarithms of Gross National Income per capita in 2011 US$ PPP among males and females in a state/UT. The subnational data on the logarithms of income is obtained from the GDL website.[59] This variable is used as a proxy for the impact of digital inclusion on the value of digital transactions in India. Studies undertaken in the global context have found that there is a negative relationship between ICT and gender inequality, and a positive correlation between gender inequality and income inequality. Digital divide reinforces other forms of inequalities such as income or gender inequalities. Therefore, gender inequality is positively correlated with digital inequality.[60],[61]
4.2. Methodology
The various equations in the above model are estimated in their log-linear form using panel regression methods. Since the interaction of various factors represented by equations (2) and (3) relate to their effect on digital transactions, they have been estimated only for the time period under study. One may argue that income and digital transactions are determined simultaneously. This argument relies on the positive impact of a rise in the share of digital transactions in the increase in total transactions, on the consumption multiplier of income. While this could be expected in the long run, it is highly unlikely in the short run being considered by this study. During the pandemic period, while digital transactions increased, economic growth was negative. These facts rule out the simultaneity of digital transactions and income in the period under study.
log yit= a logx1it + b log x2it +p log(t) +uit (4)
log x1it= c logx3it + d log x4it +e log x5it + q log(t) +vit (5)
log x2it= f logx3it + g log x4it +h log x5it + r log(t) +wit (6)
The choice between pooled ordinary least squares (POLS), fixed effects (FE) model, and random effects (RE) model is based on model selection testing, results of which are given in the Appendix. The Durbin Wu Hausman tests have been utilised for model selection. Residuals of the estimated regressions have been tested for non-stationarity to ensure valid inferences in case of non-stationary dependent and explanatory variables. Tests detecting heteroscedasticity, serial correlation and cross-sectional dependence have also been performed and standard errors robust to the presence of this statistical anomalies have been used for inference.
4.3. Results
The correlation matrix in the appendix informs us about the pair-wise correlation between the variables involved in the estimated model. Prima facie, it appears that income levels can explain the behaviour of digital transactions for the period under consideration, rather than the parameters of development relevant to the digitalisation process. Financial inclusion, adoption of network infrastructure and income are strongly positively correlated with digital transactions. Digital skills are somewhat correlated with digital transactions. Digital inequality has a negative but weak correlation with digital transactions (See correlation matrix in Appendix). The workings of the structural model outlined in the previous section seems to be comprehensively captured in terms of the significant interaction between digital transactions, income levels, financial inclusion and willingness for digital transactions.
The regression results of equation (8) suggest that a one-percent change in digital inequality is accompanied by a 2.25-percent change in digital adoption in the same direction, whereas a one-percent change in digital skills is accompanied by a 2.29-percent change in the opposite direction. Given their behaviour during the period under consideration, lower digital skills and higher digital inequality appear to more frequently be accompanied by higher digital adoption. After accounting for the impact of factors (captured by log(t)) common to the evolution of the digital payment ecosystem across states, digital skills and digital inclusion appear to capture about 91 percent of the variation in the willingness for digital adoption.
This impact cannot reflect in the pairwise correlation by virtue of its design. The result suggests a strong negative relationship between willingness for digital adoption on the one hand, and digital skills and digital inclusion on the other. Poor outcomes in terms of the latter variables have not derailed the cashless movement. In fact, digital adoption has been resilient to the decline in these variables. It appears that digital transactions have increased among those who already have digital skills and are digitally connected. This cannot be interpreted as digital inclusion and digital literacy exerting a negative influence on digital adoption. It is reasonable to conclude that for the period under consideration, the growth of digital transactions has not interacted with development in a significant manner. This does not preclude such interaction in the future.
The variation in financial inclusion is explained by the variation in income and log t accounting for about 91 percent of the same. A one-percent increase in income results in a 0.97-percent increase in digital transactions. This confirms the strong relation between these variables as reflected in their correlation.
Results suggest that the increase in the value of digital transactions is essentially captured by financial inclusion and the impact of factors (captured by log(t)) common to the evolution of the digital payment ecosystem across states. While the elasticity of digital transactions with respect to financial inclusion is 2.04, this elasticity with reference to the common factor “t” is 0.97. The responsiveness of digital transactions is the highest with respect to financial inclusion.
The significant correlation between financial inclusion and adoption of network infrastructure indicates the growing preference for mobile banking. The impact of willingness for digital adoption on digital transactions is accounted for by its interaction with financial inclusion as reflected in their correlation. It does not exert any additional influence beyond this interaction. However, this is not the case for financial inclusion. It could be the case that the increase in value of digital transactions not explained by the interaction between financial inclusion and willingness for digital adoption is being explained by the residual income effect via financial inclusion.
The coefficient on the parameter log t is significant in its explanation of the willingness for digital adoption, financial inclusion and the value of digital transactions. For example, this effectively captures the unobserved impact of digitalisation which bears upon the behaviour of digital transactions and the network effects which coexist with digital adoption. The nudge provided by the COVID-19 pandemic is also captured by this parameter.
The results suggest that the positive impact of income on digital transactions is transmitted through increased financial inclusion. To the extent that financial inclusion and digital connectivity are positively correlated, income influences the latter. The negative correlation between digital adoption, on the one hand, and digital inclusion and digital skills on the other, outweighs the positive correlation of financial inclusion with these variables in their impact on digital transactions. This is explained by the strength of the transmission mechanism existing between these variables as captured by the correlation co-efficient. This is also reflected in the elasticities of financial inclusion and digital adoption with respect to digital skills and digital inclusion. This implies that gains in income are not being adequately translated into improvements in digital skills and digital inclusion. In other words, while increase in income has boosted increase in digital transactions, developmental parameters like digital literacy and/or skills and digital inclusion have not affected the size of digital payments in a significant manner.
The number of digital transactions saw a significant rise during the pandemic. The average value of digital transactions was about INR 0.19 lakh crores for the period 2018-2022 without accounting for the pandemic. The impact of the pandemic increased this average value by 57.4 percent to INR 0.30 lakh crores. However, the analysis finds that while the pandemic slightly increased the average value of CASA deposits, the uptick was not significant. It appears from the model that higher financial inclusion that existed even before the pandemic translated into higher digital transactions. As suggested by the model, without the impact of the pandemic, the annual mean size of wireless mobile internet subscriptions stood at 8.4 million. This mean value increased to 9.5 million when we consider the pandemic dummy’s impact. It appears that the pandemic increased internet connectivity among those who already had bank deposits, in turn increasing digital transactions.
5. Scenario Analysis
While the share of digital transactions has doubled from 10 percent before demonetisation to 20 percent, India continues to remain a cash-dominated economy. This section attempts to delve into the key takeaways of the estimation exercise discussed in the previous section that can inform policymaking to accelerate India’s transition to a cashless economy.
Construction of scenarios
This section creates different scenarios to highlight the gaps in what would probably be desired in those scenarios. The ‘what would probably be’ part of the scenario is constructed by assuming that the model defining the growth of digital transactions in India during 2018-19 to 2021-22 would continue to operate in the scenarios being constructed. The scenarios being constructed represent India’s growth story of digital transactions in the future. These scenarios address the following counterfactuals: (1) What if India transforms into a five trillion-dollar economy? (2) What if the average growth rate of India’s real GDP from now to the year 2030-31 is either 6.3 percent or five percent?
The construction of these scenarios relies on econometric fitting of the variables with pooled time-series and cross-section data. While forecasts are used as guiding tools to determine the different parameters of the economy in each of these scenarios for the purpose of internal consistency, the analysis itself is not a forecasting exercise. The paper is making no claim nor inference on the likelihood of the outcomes in these scenarios.
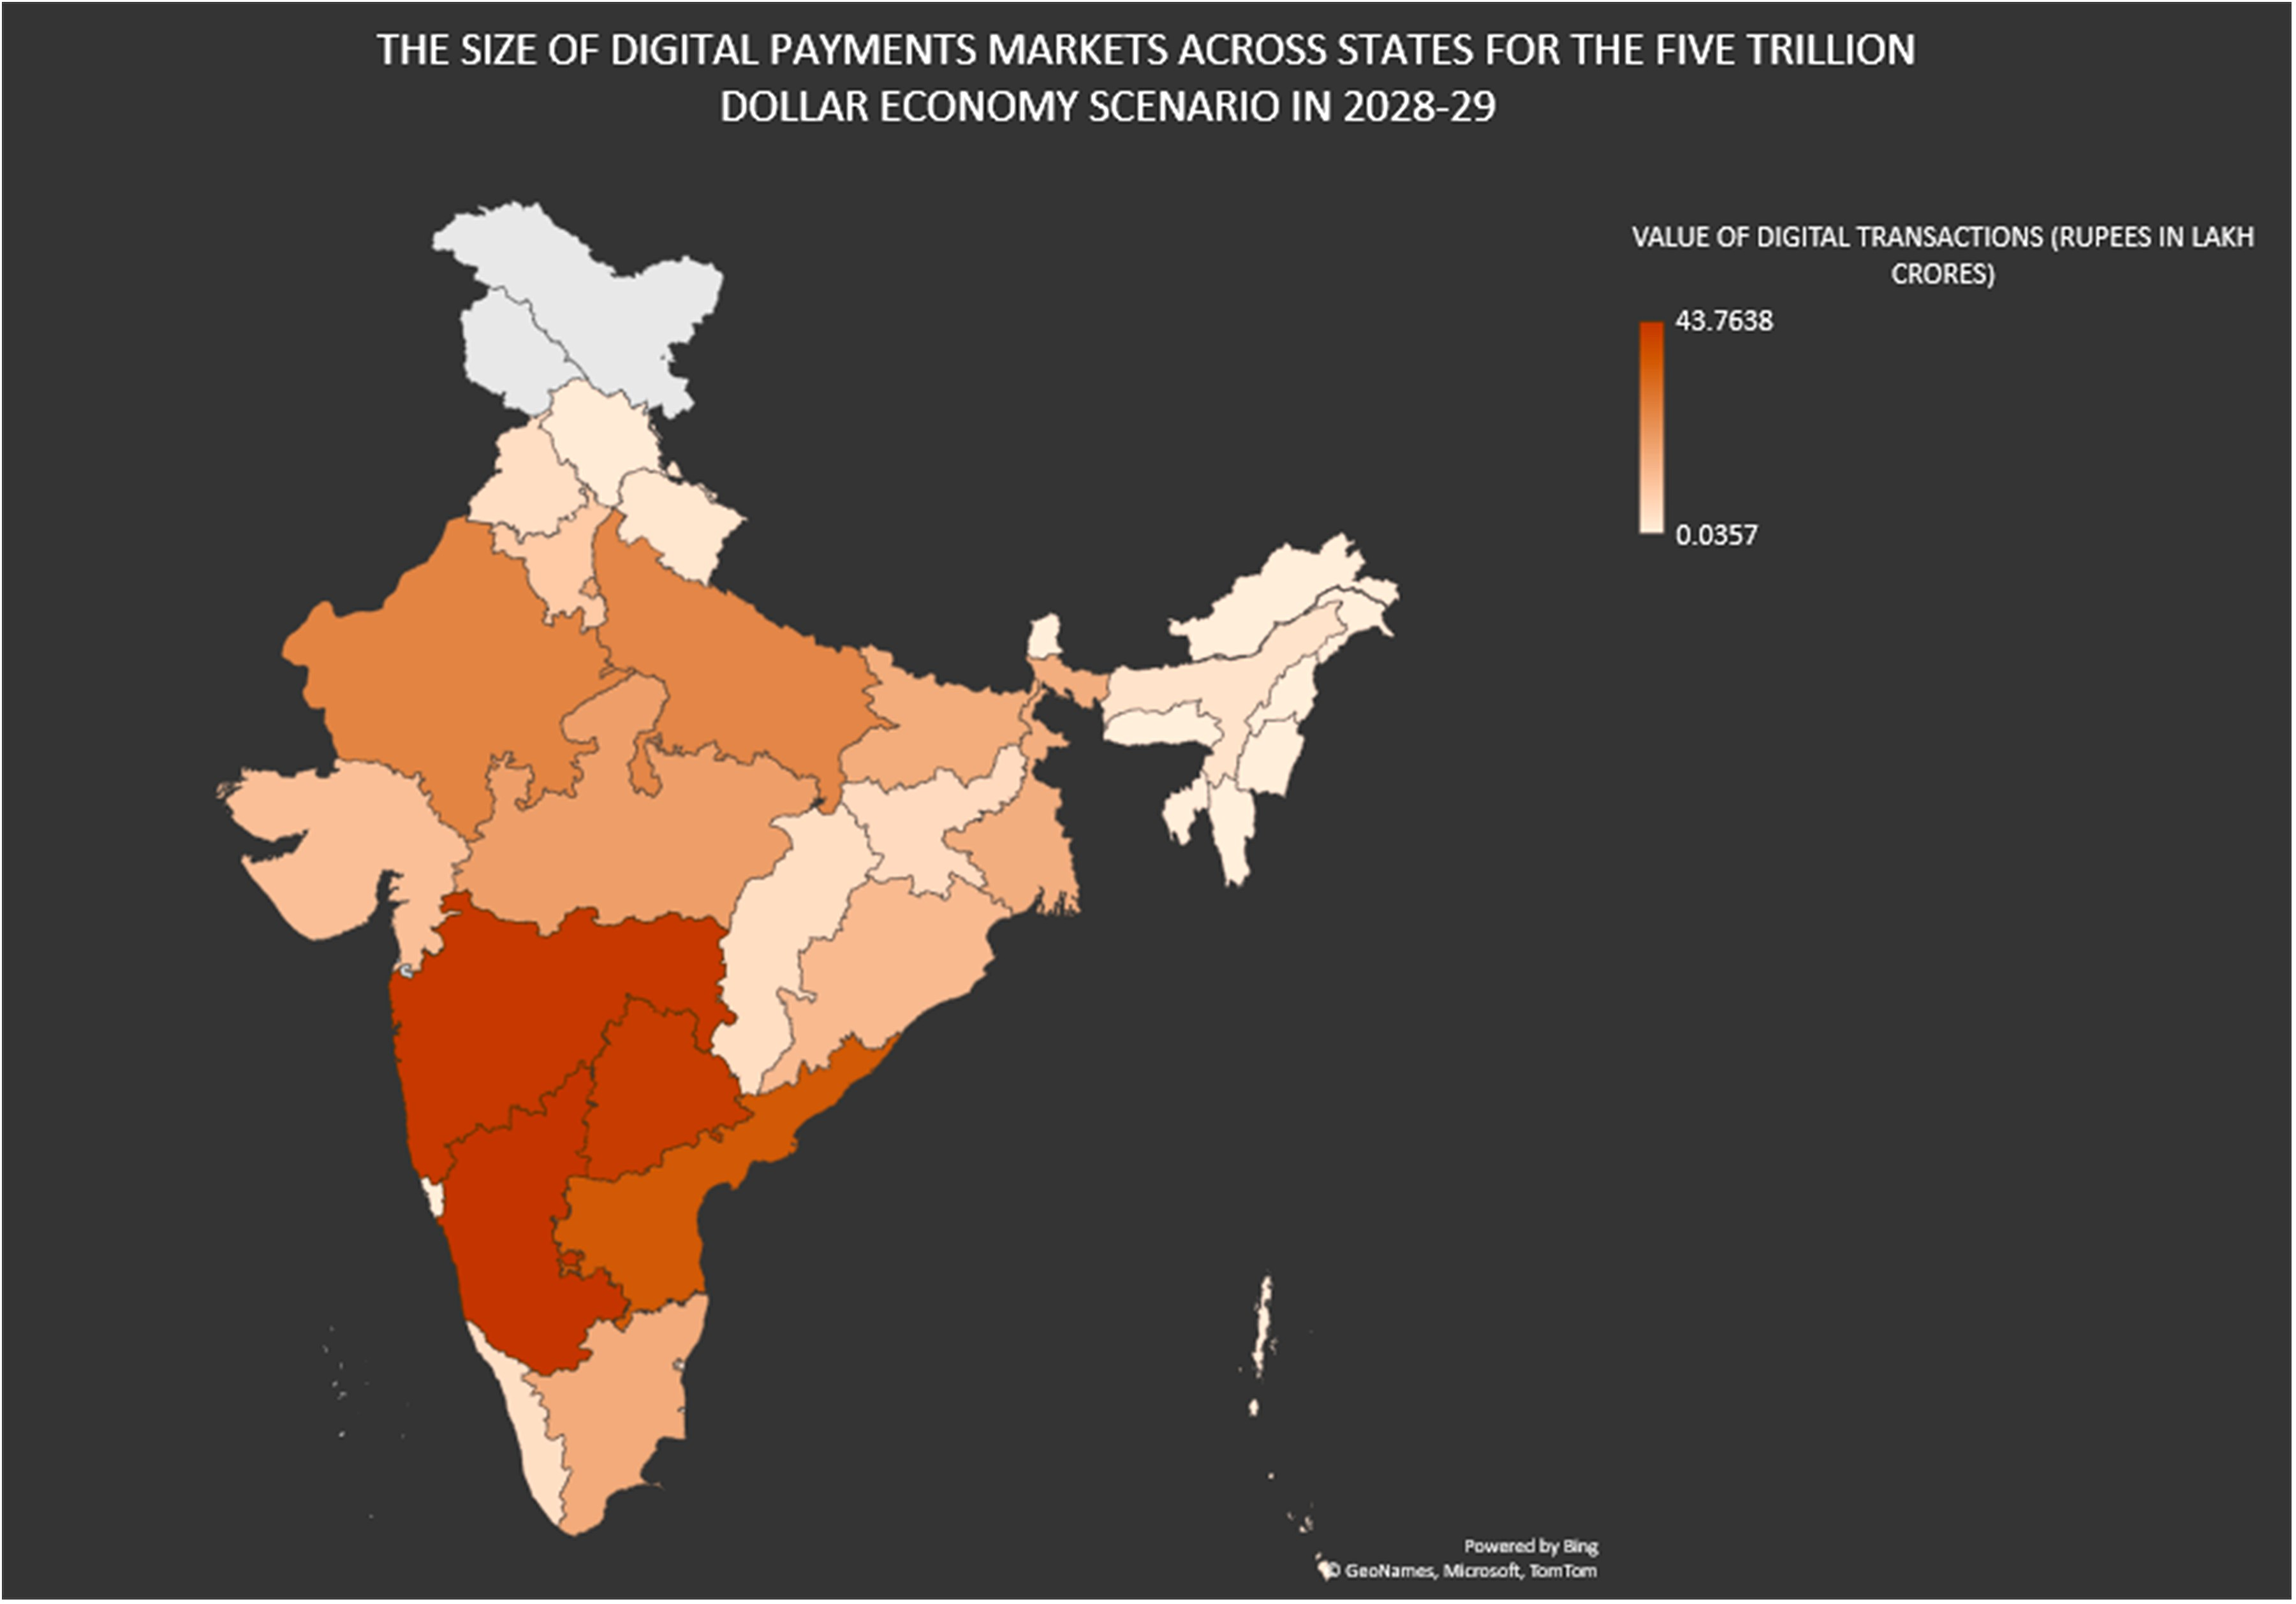
The scenario of India becoming a five trillion-dollar economy has been evaluated in three cases based on the year in which this vision is expected to be realised. While the Government of India expects the country to reach a GDP of US$5 trillion in 2025-26,[62] the International Monetary Fund forecasts 2026-27[63] as the likely year for this achievement. According to former RBI Governor D. Subbarao, the five trillion-dollar vision may be realised by 2028-29.[64] All of these cases are considered in this analysis.
Each of these cases has been built based on three exogenous parameters: exchange rate; GDP deflator; and the consumption of fixed capital (in percent). It is assumed that the behaviour of each of these parameters will be informed by their past values. This information has two components: the level and the trend of the time series underlying these parameters. It is also assumed that more recent observations exert greater influence on the future realisations. The values of these parameters are forecast for the years 2025-26, 2026-27 and 2028-29 using the double exponential smoothing technique also known as Holt’s linear trend method.
While evaluating the two possibilities of average growth between now and 2030-31, the Holt’s linear trend method is used for forecasting the GDP deflator and the consumption of fixed capital.
In each of the cases of the five trillion-dollar economy scenario, the nominal GDP of five trillion US dollars is converted into INR terms using the exchange rate. The resulting figure is then divided by the GDP deflator to arrive at the real GDP. To arrive at the NDP, the consumption of fixed capital is deducted from the real GDP. The NDP is divided across states based on the state-wise share prevalent during 2018-19 to 2021-22.
In case of the two possibilities of average growth between now and 2030-31, the real GDP is calculated for both cases. The consumption of fixed capital is then deducted from real GDP to arrive at the NDP. The NDP is divided across states based on the state-wise share prevalent during 2018-19 to 2021-22.
Table 2: Structure of the US$5T-Economy Scenarios
| STRUCTURAL PARAMETERS |
| YEAR |
EXCHANGE RATE (USD TO INR) |
GDP DEFLATOR |
RATE OF CONSUMPTION OF FIXED CAPITAL (IN PERCENT) |
| 2025-26 |
85.26 |
209.99 |
14.17 |
| 2026-27 |
87.80 |
222.34 |
14.38 |
| 2028-29 |
92.90 |
247.05 |
14.82 |
Source: Authors’ own calculations, based on data from the Reserve Bank of India,[65] indexmundi[66] and OFX[67] websites
Table 3: Structure of the Possible Growth Scenarios till 2030-31
| STRUCTURAL PARAMETERS |
| POSSIBLE GROWTH RATE (IN PERCENT) |
GDP DEFLATOR |
RATE OF CONSUMPTION OF FIXED CAPITAL (IN PERCENT) |
| 6.3 |
271.756 |
15.30 |
| 5 |
271.756 |
15.30 |
Source: Authors’ own calculations, based on data from the Reserve Bank of India,[68] indexmundi[69] and OFX[70] websites
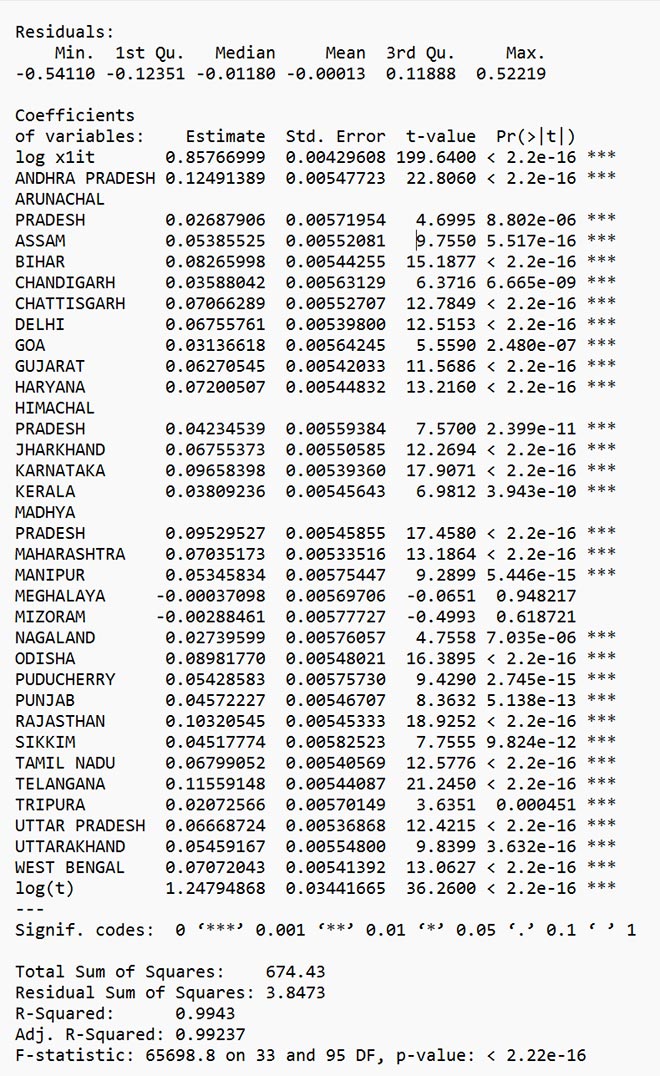
Equations 4 and 5 have been used to compute the value of digital transactions across different scenarios being considered. However, before being used for this computation, these equations have been altered to state-specific variation by including state-specific slope dummies which capture the differential impact of:
- The state-specific financial inclusion on digital transactions in equation 4
- The state-specific income on financial inclusion in equation 5
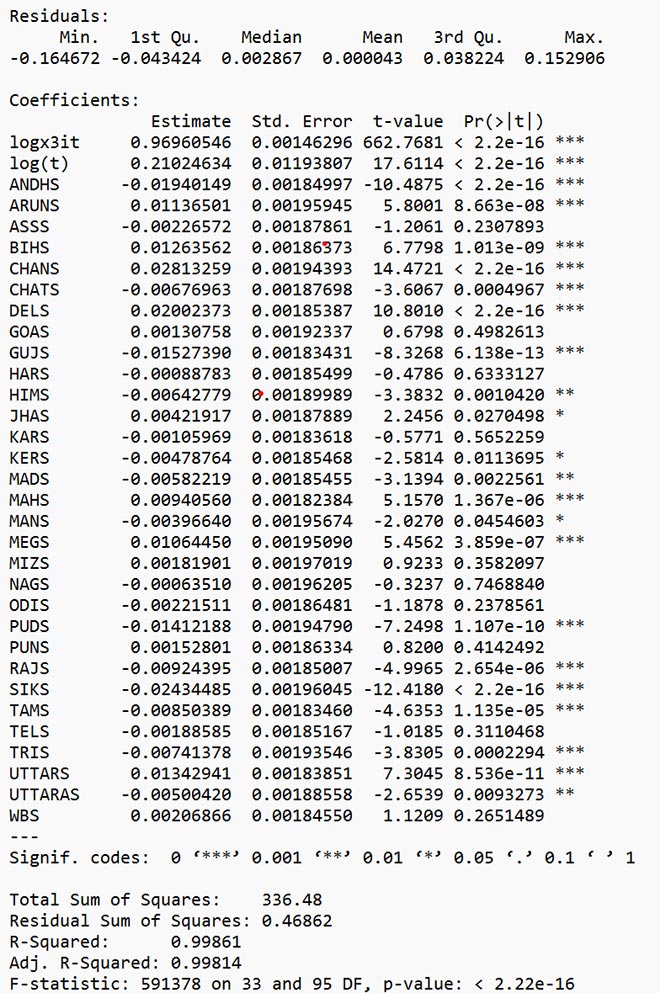
Although model selection suggests the use of RE model, the altered versions of both equations (5) and (6) are computed using pooled OLS (See Appendix). This has been done to achieve greater explanatory power which has been traded for efficiency of estimates. Results of the pooled OLS are in the appendix. Tests of stationarity suggest the absence of non-stationarity.
5.1. The US$5T-Economy Scenarios
The value of digital transactions could change across states in the five trillion-dollar Indian economy in comparison with the base case of 2021-22. At the aggregate level, digital tractions could be 2.8 to 4.25 times their value in 2021-22 depending upon the year in which the five trillion-dollar benchmark is reached.
Table 4: UPI Market Size Under US$5T-Economy Scenarios
| BASE YEAR/POSSIBLE SCENARIO |
SIZE OF THE DIGITAL PAYMENTS (UPI) MARKET (INR, IN LAKH CRORES) |
CAGR OF NOMINAL GDP (IN PERCENT) |
CAGR OF REAL GDP (IN PERCENT) |
SHARE OF VALUE OF UPI TRANSACTIONS AS A PERCENT OF NOMINAL GDP |
| 2021-22 (Base Case) |
83.8 |
NA |
NA |
35.4 |
| 2025-26 scenario |
242.7 |
15.9 |
8.34 |
56.9 |
| 2026-27 scenario |
280.3 |
13.2 |
6.03 |
63.8 |
| 2028-29 scenario |
356.3 |
10.1 |
4 |
76.7 |
Source: Estimated by authors.
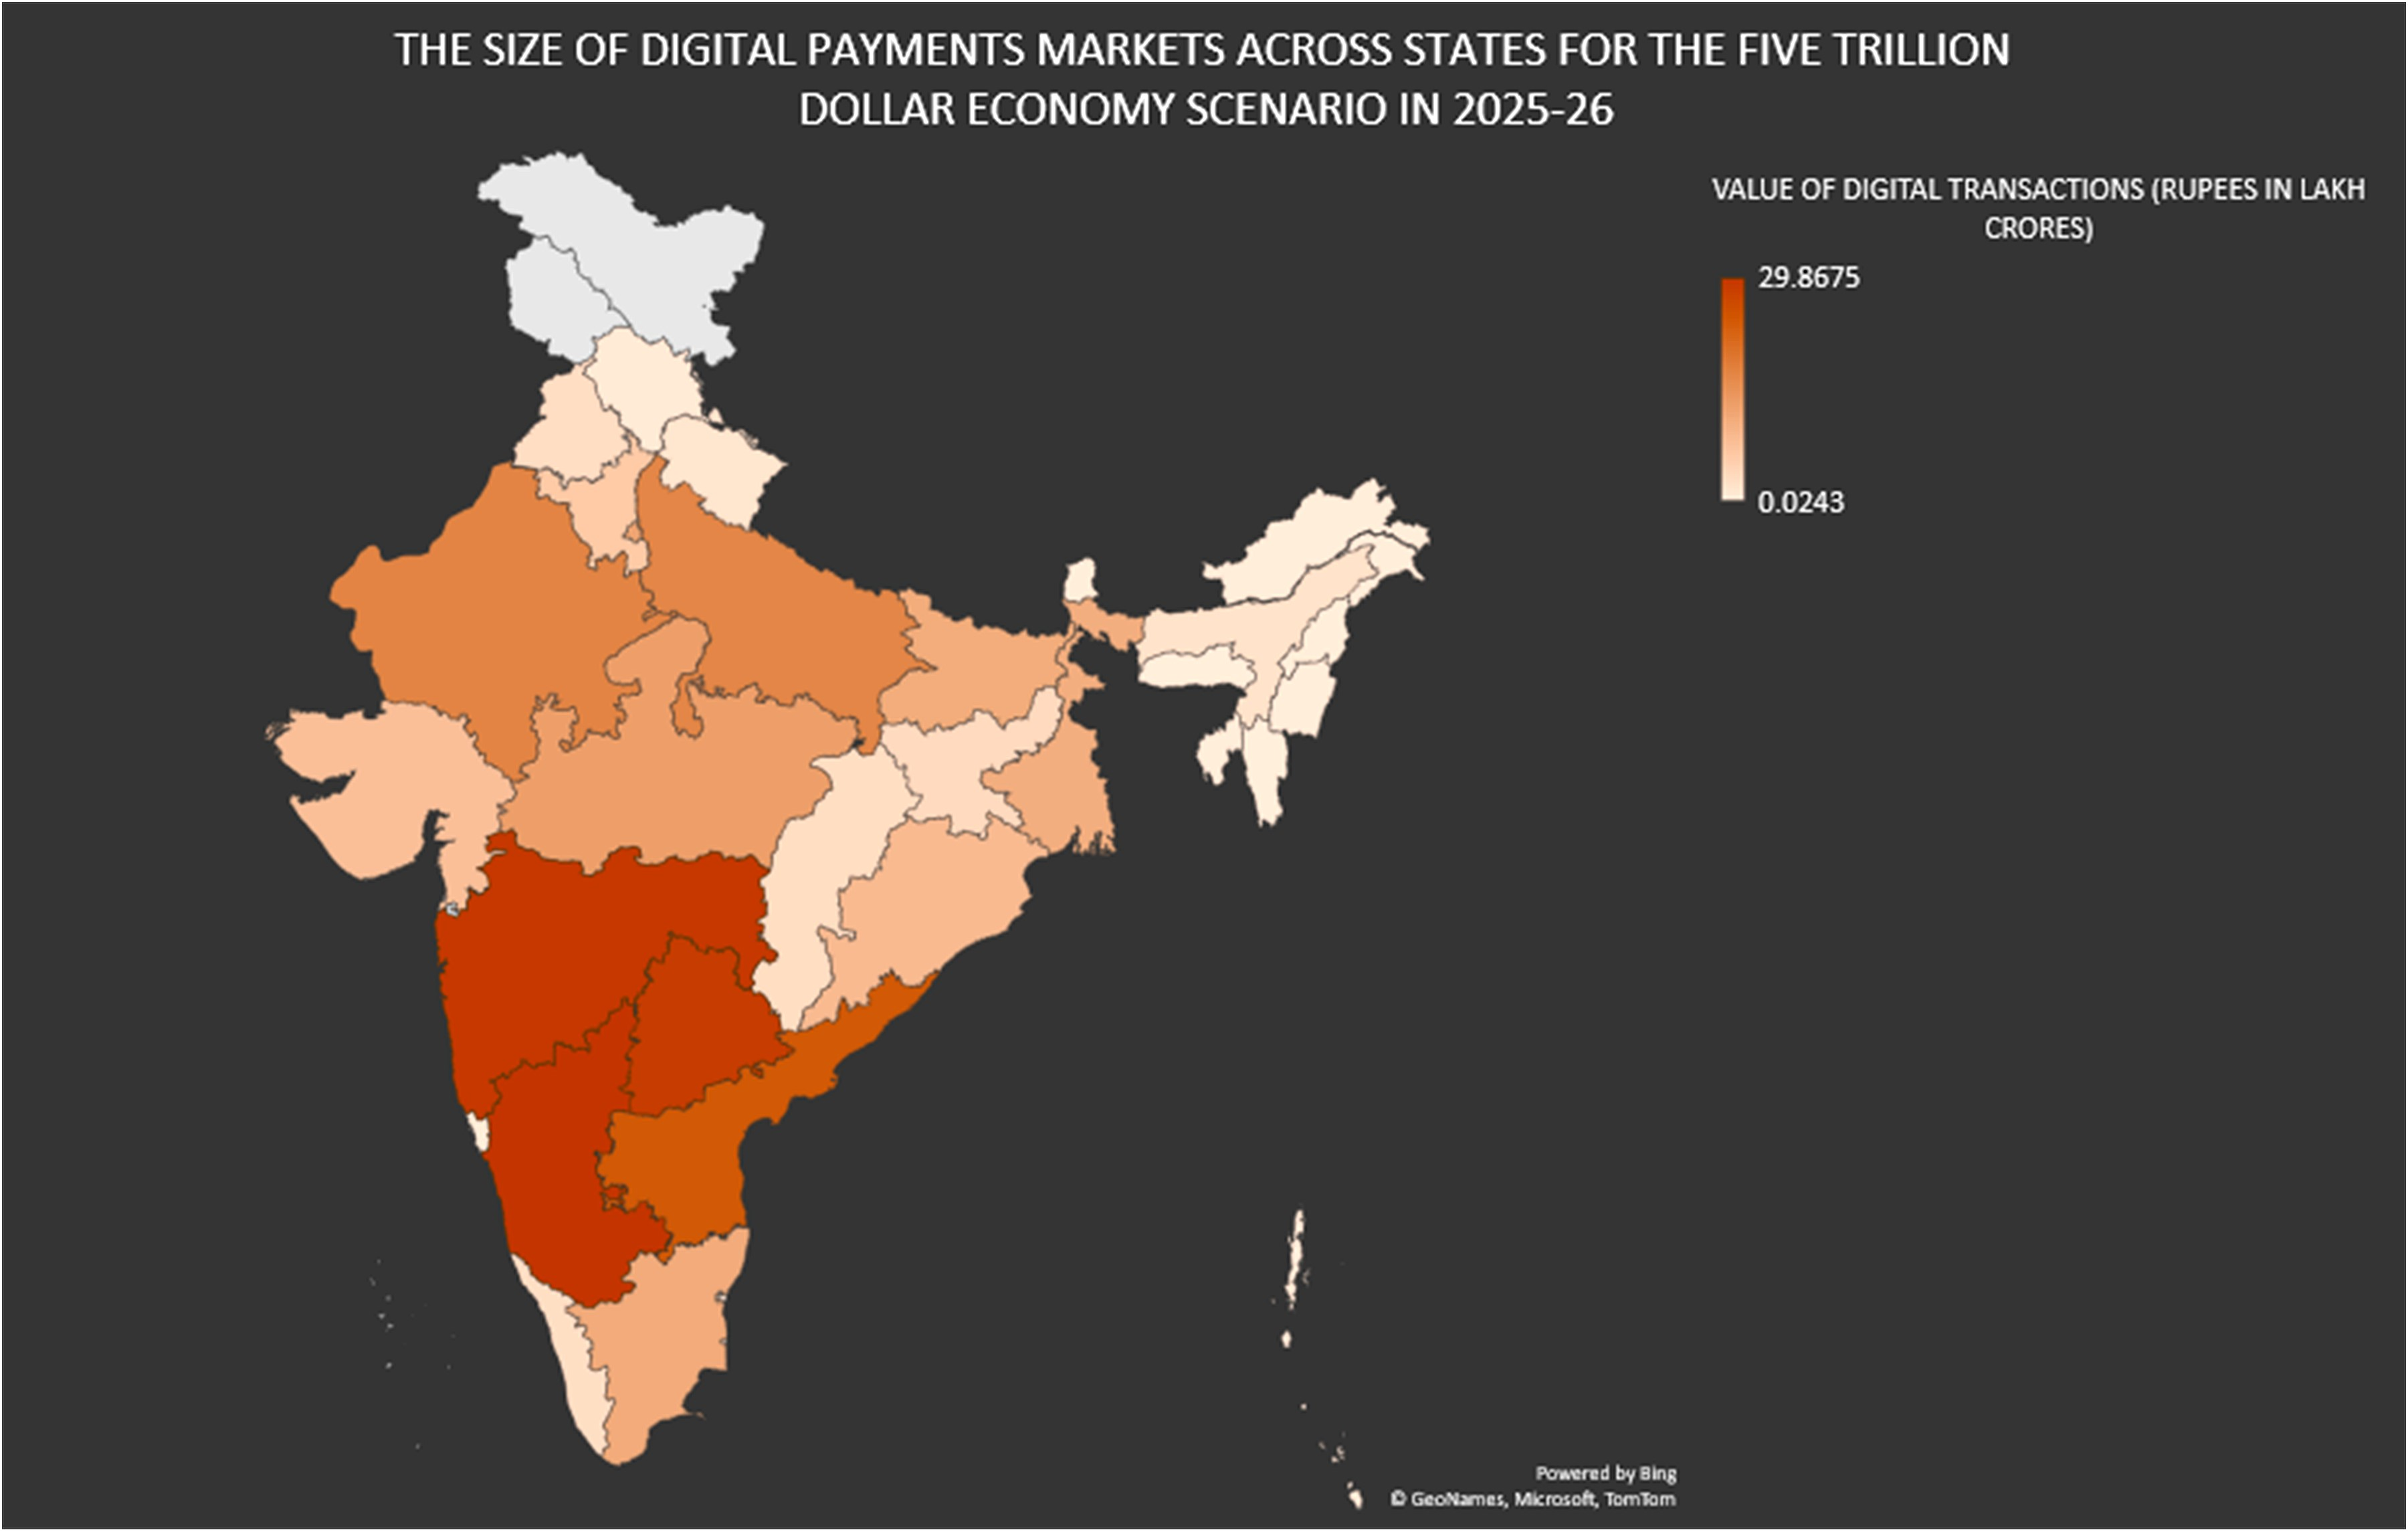
The state-wise contributions to the national level UPI market size of the US$5T-economy scenarios are given in the appendix. In 2021-22, north-eastern states appear at the bottom on account of lower digital payment outcomes while south Indian states except Kerala registered the best performance among all states. This pattern of performance at the zonal level could largely continue in this scenario. Telangana occupies the top spot among states/UTs in 2021-22. However, Karnataka could emerge the best performer and displace Telangana in the five trillion-dollar scenario irrespective of the year of achievement. Maharashtra could retain its second position.
It is important to note that these states are also those that could encounter the maximum in-migration due to their leadership positions in Information Technology and Finance & Banking. Given that, there may be a tendency on the part of the growing migrating population to use digital services rather than cash in their financial transactions. Then, technology development and adoption in those spaces have also been growing at a faster rate than other states of India. Incidentally, Andaman and Nicobar Islands could remain at the bottom as in the baseline scenario. The relative performances of states/UTs in terms of the size of digital markets could be replicated by subnational performance in terms of the share in nominal GDP and total digital transactions.
All states and UTs could register an increase in the size of their digital payments markets. The largest increase could be registered in Chandigarh, followed by Himachal Pradesh and Tripura across all scenarios. Andaman and Nicobar Islands could record the smallest increase in digital transactions across all scenarios. All states/UTs except Andaman and Nicobar Islands could experience more than 100-percent increase in the value of their digital transactions in the 2025-26 scenario. Chandigarh could outperform all by registering a 305-percent increase in the size of its digital markets.
All states/UTs could see more than 100-percent increase in the value of their digital payments market in the 2026-27 scenario. Except Andaman and Nicobar Islands and Manipur, all states and UTs could register at least a 200-percent increase in the size of their digital payments market in this scenario (the low base effect). Seven states/UTs—namely, Chandigarh, Himachal Pradesh, Tripura, Punjab, Sikkim and Delhi—could record more than a 300-percent increase in the value of their digital transactions, all of which can also be attributed to the low base effect.
All states and UTs but Andaman and Nicobar Islands could register more than 200-percent increase in the value of their digital transactions in the 2028-29 scenario. Manipur, Assam, Rajasthan, Telangana and Madhya Pradesh could register an increase between 200 and 300 percent. Chandigarh, Himachal Pradesh, Tripura, Punjab, Sikkim, Delhi, Mizoram and Tamil Nadu could record more than a 400-percent increase in the value of their digital transactions.
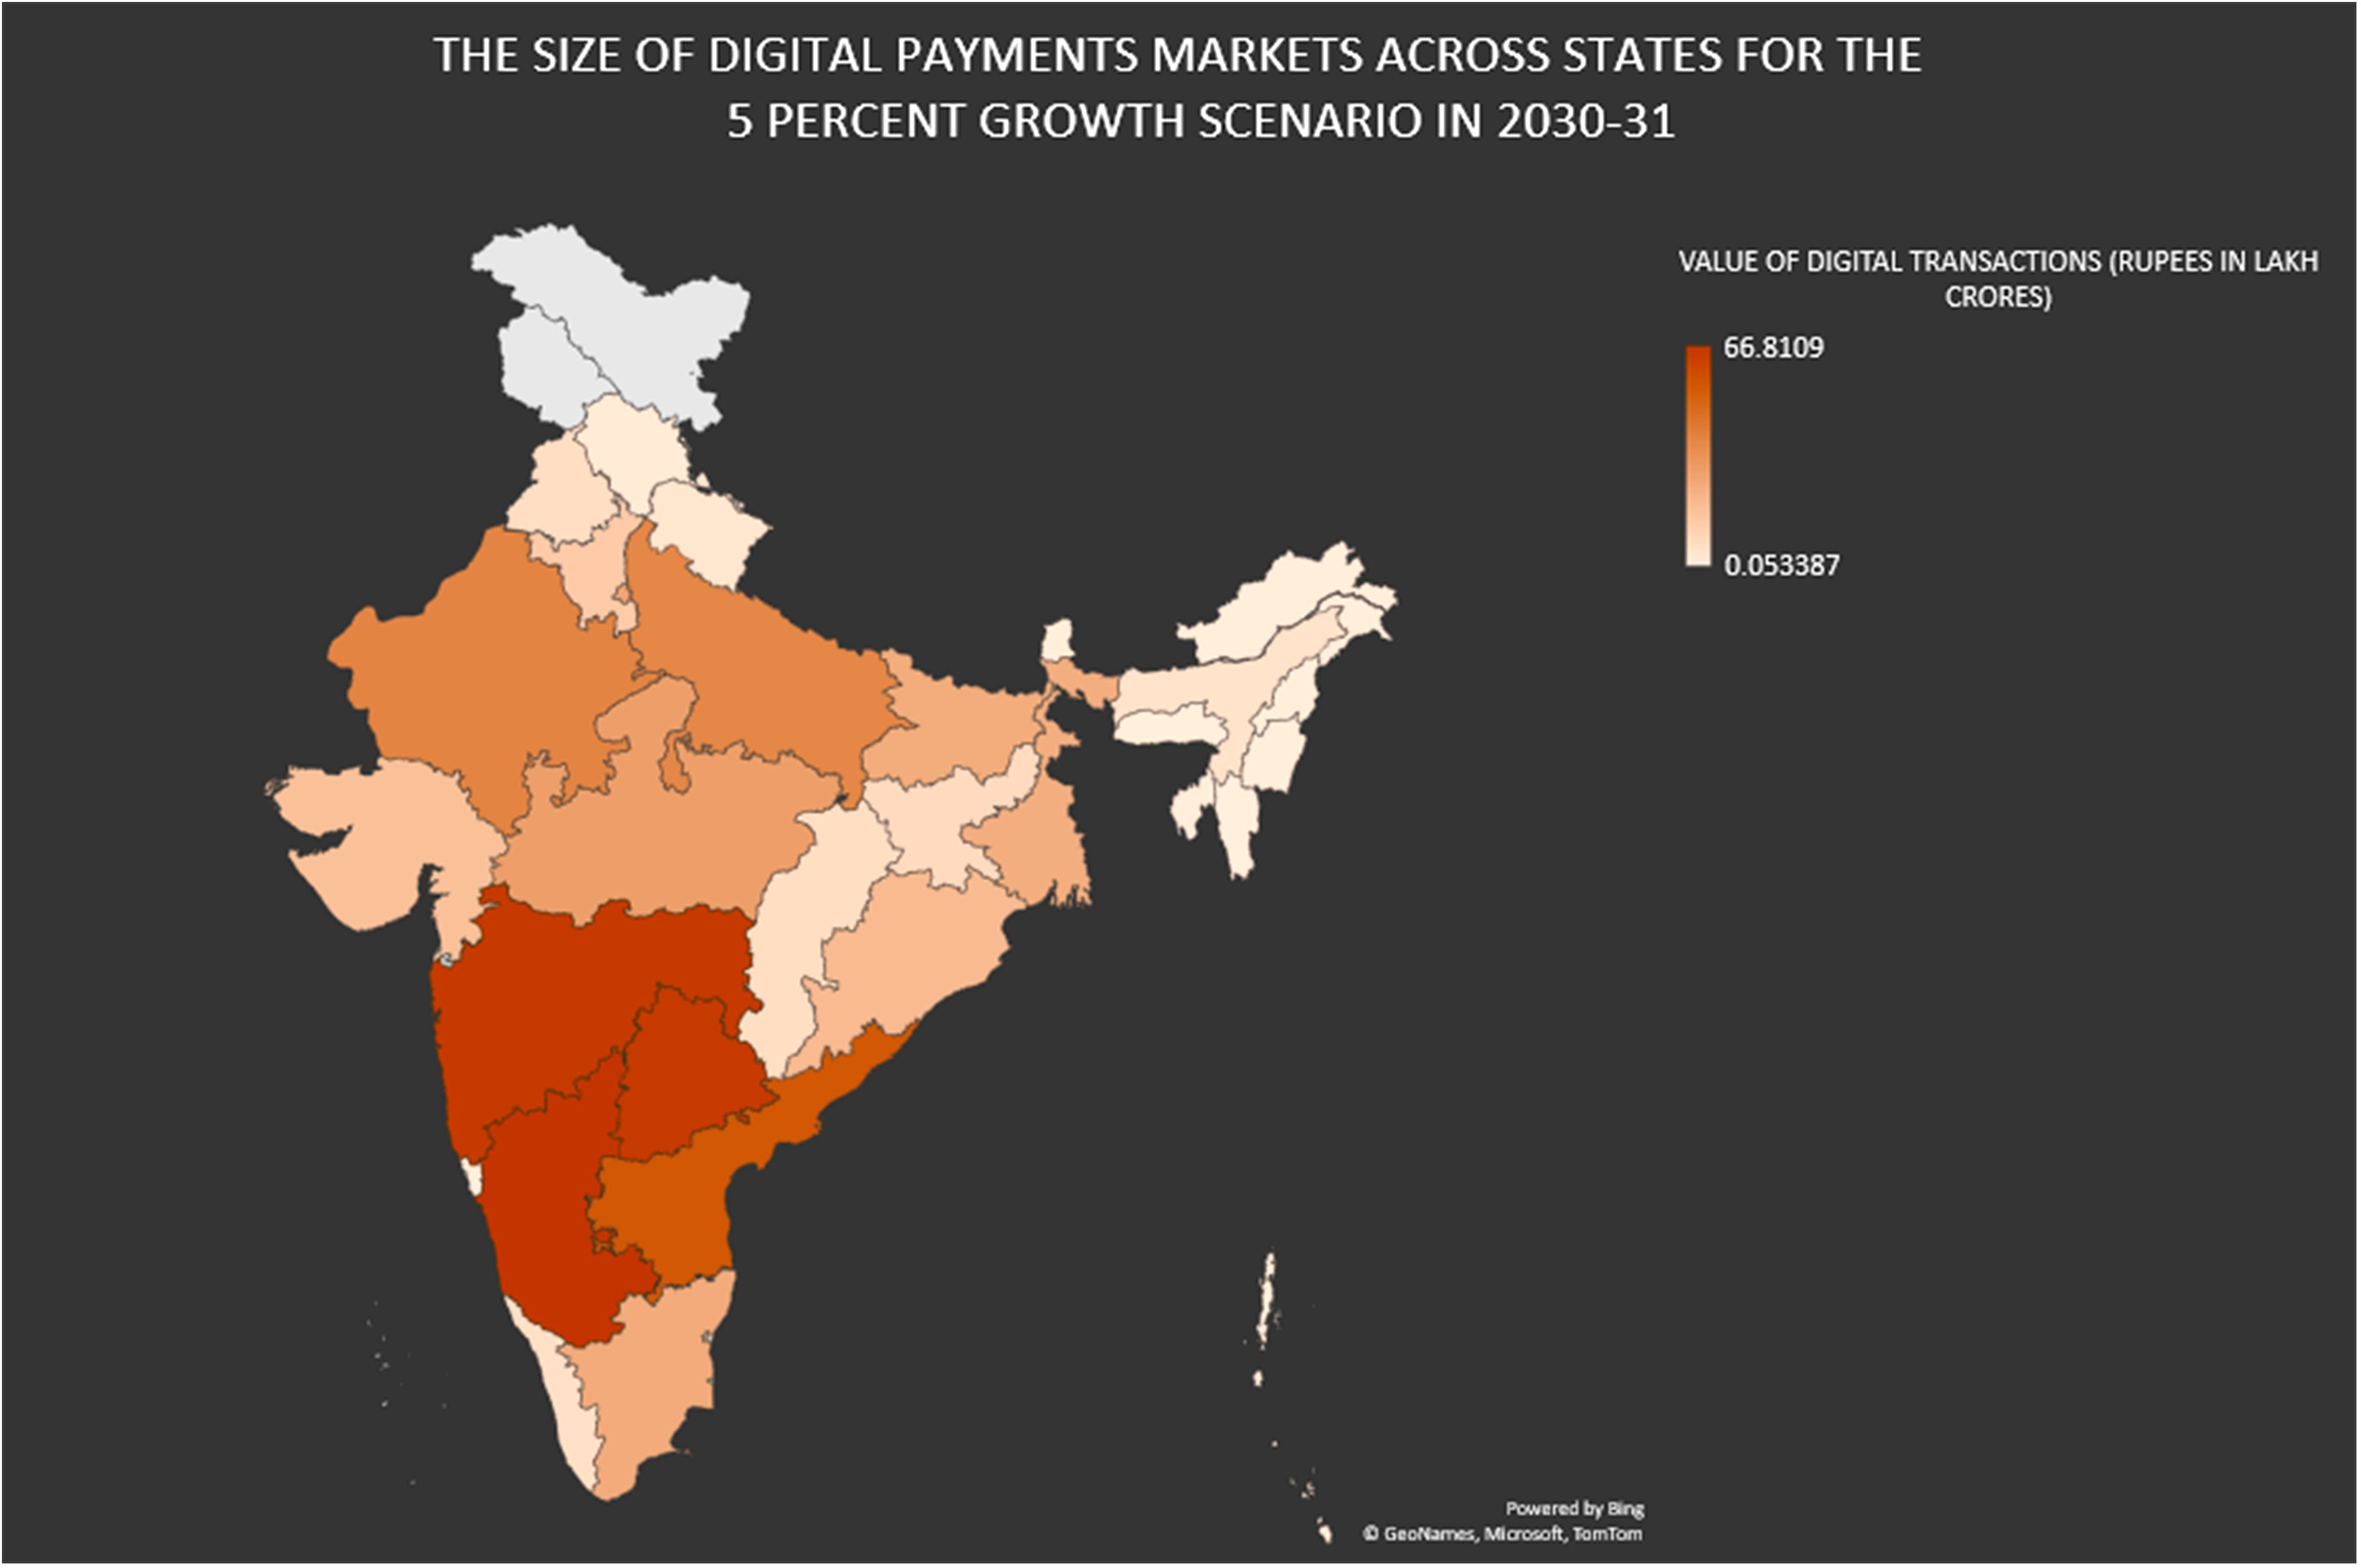
5.2. Possible Growth Scenarios Upto the Year 2030-31
This section evaluates digital transactions in the case of two growth possibilities for the year 2030-31.
Table 5: UPI Market Size Under Possible Growth Scenarios till 2030-31
| BASE YEAR/POSSIBLE GROWTH SCENARIO (GROWTH RATE IN PERCENT) |
SIZE OF THE DIGITAL PAYMENTS (UPI) MARKET (INR, IN LAKH CRORES) |
CAGR OF NOMINAL GDP (IN PERCENT) |
SHARE OF VALUE OF UPI TRANSACTIONS AS A PERCENT OF NOMINAL GDP |
| 2021-22 |
83.8 |
NA |
35.4 |
| 6.3 |
600.7 |
12.9 |
85.4 |
| 5 |
542.7 |
11.5 |
86.2 |
Source: Authors’ own calculations
The scenario analysis finds that if India were to achieve 6.3 percent growth in FY 2030-31, the value of digital transactions could be about 7.2 times its value in 2021-22. If, instead, the growth rate were five percent, then the impact of the estimated model could result in the value of digital payments being 6.5 times their value in 2021-22. In both growth scenarios, the relative performance of states/UTs in terms of the size of digital transactions and an increase in it, share of nominal GDP and share of total digital transactions replicates that of scenario one.
In case of the 6.3 percent growth scenario, all states/UTs but Andaman and Nicobar Islands and Manipur could register more than 500 percent increase in the value of their digital transactions. Chandigarh and Himachal Pradesh could record between 800 and 900 percent increase in the value of their digital transactions.
In case of the five percent growth scenario, all states/UTs but Andaman and Nicobar Islands could experience greater than 400 percent increase in the value of digital transactions. Manipur, Assam, Rajasthan and Telangana could see an increase between 400 and 500 percent. A majority of states could see an increase between 500 and 600 percent in the value of their digital transactions. Chandigarh, Himachal Pradesh and Tripura could witness an increase between 700 and 800 percent in the value of their digital transactions.
Depending on how the model of growth in digital transactions evolves, the value of digital transactions presented in this analysis could indicate an upper bound, a lower bound or the mean value of digital transactions that can be expected. The reality is more likely to deviate from the model as development begins to systematically influence the value of digital transactions or as the value of digital transactions begins to demonstrate constant or decreasing returns to scale or both.
If the influence of financial inclusion on the value of digital transactions captured by the model estimated in this paper remains constant and the model exhibits increasing returns to scale but development begins to influence the value of digital transactions via increases in digital skills and digital inclusion, then the digital transactions computed under scenario analysis are likely to be a lower bound for what can be expected in reality if the scenario occurred. If, on the other hand, the influence of financial inclusion on the value of digital transactions remains unchanged and development does not exert a statistically significant influence on it, but the model begins to exhibit constant or decreasing returns to scale, then the digital transactions calculated in the scenario analysis are likely to be an upper bound for what can be expected in reality.
If state-wise shares in national income are allowed to change, the deviation between the model and reality is likely to become more pronounced. To the extent that holding the shares of states in national income constant affects the impact of inequalities on the value of digital transactions, results of the scenario analysis cannot adequately capture this impact. The relative performance of states/UTs observed in the scenario analysis is an artefact of this assumption. Having assumed that the scale (but not the location) of the income distribution among states remains unchanged, the impact of the change in inequalities on the growth of digital transactions have not been adequately captured in the scenario analysis. While the estimation of the model assumes that the inter-state inequalities have remain unchanged, intra-state inequalities have been addressed in the analysis. Accounting for these inter-state inequalities would have important implications for the growth of digital transactions.
6. Discussion
A more effective strategy for accelerating digital payments in India requires a nuanced understanding of the responsiveness of such payments to fundamental factors that influence them. Such understanding acquires importance amidst binding fiscal constraints. The above analysis is an attempt at such understanding. The existing structural model governing the behaviour of digital transactions can be altered by influencing the parameters of the model. This is made possible by strengthening the interaction between factors and effect a systematic impact on the value of digital transactions.
India has made significant gains in financial inclusion in the recent years. Government schemes such as the exemplary Pradhan Mantri Jan Dhan Yojana which seek to promote social security among the economically vulnerable populations have been instrumental in making such gains.[71] There is much room to grow, however, and further increments in financial inclusion can boost the uptake of digital payments. The high elasticity of digital transactions with respect to financial inclusion demonstrated by the foregoing analysis can be maintained or even strengthened by implementing appropriate solutions. The potential impact of digital inclusion and digital literacy can be unleashed for this purpose, as seen in the positive yet insignificant interaction between financial inclusion on the one hand and digital literacy and digital inclusion on the other.
Prioritising universal coverage by addressing structural issues of the financial system—such as rationalisation of interest rates, streamlining of loan delivery, and simplification of processes involved in accessing banking services—can attract greater preference for banking, especially in the digital mode.[72]
Digital banking can be made more accessible by understanding digital divide in the context of banking and customising banking solutions that address the diverse needs of the potential customer.[73] Linguistic barriers to digital banking represent one dimension of such digital divide. Deployment of cost-effective and offline digital payments infrastructure can play an important role in addressing India’s digital divide. Financial inclusion can be widened and deepened by identifying solutions that reduce the transaction cost of banking services.[74] Meanwhile, the gender digital divide can be bridged by investing in the growth of human capital, and the ability to drive innovation and assume leadership in the process of digital development.[75] Making education compulsory can aid the growth of human capital among women, as could the promotion of STEM education, increasing awareness about educational opportunities, and eliminating barriers to adult education. Improving labour market participation and galvanising women’s labour participation can translate human capital accumulation into economic progress.
Bridging the digital divide beyond gender is also strongly linked to eliminating constraints stemming from digital illiteracy, which amplify threats posed by bank fraud and cybercrime and impede the uptake of online banking. Mechanisms that address novelty-related risks, agent-related risks and digital-technology-related risks accompanying the uptake of digital solutions are pertinent to addressing digital literacy.[76] Schemes can deliver greater impact by considering the diversity of usage patterns explained by differences in parameters such as age, education, gender and affinity for technology interaction that are relevant to such internet usage.[77] Building institutional capacity that supports efforts for improving financial awareness can help transform physical financial inclusion into digital banking.[78] The impact of digital literacy programmes can be deepened by expanding the application of digital tools for enhancing livelihoods. In other words, the fundamental structure of such literacy programmes must incorporate concerns of employability.[79]
7. Conclusion
This paper aimed to make certain projections on the size of India’s UPI payments market under certain hypothetical scenarios of economic growth. The authors have not claimed that these are forecasts based on trend data or time-series econometrics, as the task is not possible given the limitations of the data-sets presently available. The simple frameworks adopted by this paper do not accommodate the structural breaks that could unfold in the future. Therefore, all the numbers that have been generated in this exercise are based on assumptions of certain “controlled conditions” as are prevalent in the base case, while we look at a condition when some exogenous parameters are changed from the base case. Here, the concerned exogenous variable is economic growth, as dictated by the scenarios.
Nonetheless, these constraints do not take away the relevance of the policy recommendations outlined in this paper. While conducting the exercise to devise quantitative scenarios, the paper has been able to provide insights into developing an efficient strategy required for galvanising India’s transition into a cashless economy. The paper conceptualises a model that seeks to explain growth in the value of digital transactions by quantifying the interaction between factors that are fundamental to this growth. A parametric structure of the transmission mechanism that defines the interaction between financial inclusion, digital inclusion, digital skills and digital adoption—as they relate to the behaviour of digital transactions—is developed and estimated.
The estimation finds that financial inclusion has been the driving force underlying the digitalisation of India’s payments system. Results suggest that improving the performance of digital literacy and digital inclusion can recalibrate the growth of digital transactions for better outcomes. This paper finds that the impact of the pandemic was likely demonstrated in terms of greater adoption of the internet among those who were already financially connected.
The analysis also hints at possible changes that can alter the current structure of growth in digital payments. Based on the results of the statistical exercise undertaken for this paper, possible actions for rapid digitalisation of the payments system were outlined as well. While the paper identifies the interaction between development and digitalisation in India in the context of its payments system, there is clear implication of the tremendous scope for strengthening this interaction.
From an academic standpoint, this paper has been able to fill an important gap in digital policy literature. There has hardly been an analysis that has explicitly looked at the interaction of macroeconomic and developmental variables with the domain of digital transactions. Existing research is few and far between, and a quantitative assessment framework to understand such interactivity is conspicuous by its absence. This paper not only bridges that existing gap, but also attempts to create a replicable quantitative framework that can help understand such interactivities, and create scenarios for future decision-making and policy formulation.
Dr Renita D' Souza is a Fellow at ORF.
Dr Nilanjan Ghosh is Director of ORF's Centre for New Economic Diplomacy and the Kolkata Centre.
The authors acknowledge Phonepe's help in accessing their dataset. Comments from ORF colleagues, Dr. Aditya Bhan, Soumya Bhowmick, and Debosmita Sarkar, as well as from two anonymous reviewers helped improve the draft.
APPENDICES
CORRELATION MATRIX BETWEEN VARIABLES
| Variables |
yit (Digital Transactions) |
x1it (Financial Inclusion ) |
x2it (Digital Con nectivity) |
x3it (Income) |
x4it (Digital skills) |
x5it (Digital divide) |
| yit (Digital Transactions) |
1 |
0.9259014 |
0.9112424 |
0.9132433 |
-0.4170738 |
-0.1872754 |
| x1it (Financial Inclusion) |
0.9259014 |
1 |
0.9736559 |
0.9799229 |
-0.3781171 |
-0.1577396 |
| x2it (Digital Con nectivity) |
0.9112424 |
0.9736559 |
1 |
0.9790816 |
-0.4599629 |
-0.2662558 |
| x3it (Income) |
0.9132433 |
0.9799229 |
0.9790816 |
1 |
-0.4129747 |
-0.1678337 |
| x4it (Digital skills) |
-0.4170738 |
-0.3781171 |
-0.4599629 |
-0.4129747 |
1 |
0.7938835 |
| x5it (Digital divide) |
-0.1872754 |
-0.1577396 |
-0.2662558 |
-0.1678337 |
0.7938835 |
1 |
ESTIMATION OF REGRESSION MODELS
All the specifications of equations 4, 5 and 6 have been estimated using fixed effects model.
Equation 4
Regression results of equation (4) are as follows:
| Variables |
Estimate of coefficients |
Standard error |
t-value |
P-value (Probability >|t|) |
| log x1it |
2.20536 |
0.36437 |
6.0526 |
2.972e-08 *** |
| log x2it |
0.44888 |
0.58329 |
0.7696 |
0.4435 |
| log t |
0.83361 |
0.18981 |
4.3919 |
2.972e-05 *** |
| Signif. codes: 0 ‘***’ 0.001 ‘**’ 0.01 ‘*’ 0.05 ‘.’ 0.1 ‘ ’ 1 Total Sum of Squares: 80.913 Residual Sum of Squares: 3.3466 R-Squared: 0.95864 Adj. R-Squared: 0.94352 F-statistic: 718.503 on 3 and 93 DF, p-value: < 2.22e-16 |
Given the statistical insignificance of log x2it, this variable is dropped from equation 4 and re-estimated again. Results of this estimation are as follows:
| Variables |
Estimate of coefficients |
Standard error |
t-value |
P-value (Probability >|t|) |
| log x1it |
2.042939 |
0.296368 |
6.8933 |
6.19e-10 *** |
| log t |
0.965622 |
0.081048 |
11.9142 |
< 2.2e-16 *** |
| Signif. codes: 0 ‘***’ 0.001 ‘**’ 0.01 ‘*’ 0.05 ‘.’ 0.1 ‘ ’ 1 Total Sum of Squares: 80.913 Residual Sum of Squares: 3.3679 R-Squared: 0.95838 Adj. R-Squared: 0.94376 F-statistic: 1082.15 on 2 and 94 DF, p-value: < 2.22e-16 |
Equation 5
Regression results of equation (5) are as follows:
| Variables |
Estimate of coefficients |
Standard error |
t-value |
P-value (Probability >|t|) |
| log x3it |
0.363222 |
0.130895 |
2.7749 |
0.006688 ** |
| log x4it |
4.397451 |
0.748898 |
5.8719 |
6.775e-08 *** |
| log x5it |
-1.143307 |
0.609201 |
-1.8767 |
0.063724 . |
| log t |
0.203238 |
0.011192 |
18.1589 |
< 2.2e-16 *** |
| Signif. codes: 0 ‘***’ 0.001 ‘**’ 0.01 ‘*’ 0.05 ‘.’ 0.1 ‘ ’ 1 Total Sum of Squares: 2.5947 Residual Sum of Squares: 0.25025 R-Squared: 0.90355 Adj. R-Squared: 0.86686 F-statistic: 215.47 on 4 and 92 DF, p-value: < 2.22e-16 |
Statistical investigation of equation 5 suggests the following parsimonious model while improving the explanatory power of the model. Hence this model is finalised for this analysis.
| Variables |
Estimate of coefficients |
Standard error |
z-value |
P-value (Probability >|z|) |
| log x3it |
0.9686957 |
0.0021216 |
456.577 |
< 2.2e-16 *** |
| log t |
0.2101087 |
0.0116011 |
18.111 |
< 2.2e-16 *** |
| Signif. codes: 0 ‘***’ 0.001 ‘**’ 0.01 ‘*’ 0.05 ‘.’ 0.1 ‘ ’ 1 Total Sum of Squares: 6.0961 Residual Sum of Squares: 0.58696 R-Squared: 0.90451 Adj. R-Squared: 0.90375 Chisq: 217141 on 2 DF, p-value: < 2.22e-16 |
Equation 6
Regression results of equation 6 are as follows:
| Variables |
Estimate of coefficients |
Standard error |
t-value |
P-value (Probability >|t|) |
| log x3it |
-0.0629818 |
0.0837697 |
-0.7518 |
0.4541 |
| log x4it |
-2.1904455 |
0.4792751 |
-4.5703 |
1.511e-05 *** |
| log x5it |
2.0841119 |
0.3898728 |
5.3456 |
6.516e-07 *** |
| log t |
0.2174688 |
0.0071627 |
30.3612 |
< 2.2e-16 *** |
| Signif. codes: 0 ‘***’ 0.001 ‘**’ 0.01 ‘*’ 0.05 ‘.’ 0.1 ‘ ’ 1 Total Sum of Squares: 1.5926 Residual Sum of Squares: 0.1025 R-Squared: 0.93564 Adj. R-Squared: 0.91116 F-statistic: 334.373 on 4 and 92 DF, p-value: < 2.22e-16 |
Given the statistical insignificance of the variable log x3it , it has been dropped from the final specification of equation 6.
| Variables |
Estimate of coefficients |
Standard error |
t-value |
P-value (Probability >|t|) |
| log x4it |
-2.2985167 |
0.4561424 |
-5.0390 |
2.293e-06 *** |
| log x5it |
2.2539317 |
0.3170349 |
7.1094 |
2.343e-10 *** |
| log t |
0.2151629 |
0.0064578 |
33.3185 |
< 2.2e-16 *** |
| Signif. codes: 0 ‘***’ 0.001 ‘**’ 0.01 ‘*’ 0.05 ‘.’ 0.1 ‘ ’ 1 Total Sum of Squares: 1.5926 Residual Sum of Squares: 0.10312 R-Squared: 0.93525 Adj. R-Squared: 0.91157 F-statistic: 447.735 on 3 and 93 DF, p-value: < 2.22e-16 |
MODEL SELECTION TESTS FOR THE FINALISED SPECIFICATIONS OF EQUATIONS 4,5 and 6
Equation 4
- Test for choice between FE and POLS for equation 4
F test for individual effects
data: log yit ~ log x1it+ log t + 0
F = 78.969, df1 = 32, df2 = 94, p-value < 2.2e-16
alternative hypothesis: significant effects
- Test for choice between RE and POLS for equation 4
Lagrange Multiplier Test - (Breusch-Pagan)
data: log yit ~ log x1it+ log t + 0
chisq = 169.59, df = 1, p-value < 2.2e-16
alternative hypothesis: significant effects
- Test for choice between FE and RE for equation 4
Hausman Test
data: log yit ~ log x1it+ log t + 0
chisq = 14.387, df = 2, p-value = 0.0007513
alternative hypothesis: one model is inconsistent
Equation 5
Test for choice between FE and POLS for equation 5
F test for individual effects
data: log x1it~ log x3it+ log t+0
F = 89.843, df1 = 32, df2 = 94, p-value < 2.2e-16
alternative hypothesis: significant effects
- Test for choice between RE and POLS for equation 5
Lagrange Multiplier Test - (Breusch-Pagan)
data: log x1it~ log x3it+ log t+0
chisq = 172.33, df = 1, p-value < 2.2e-16
alternative hypothesis: significant effects
- Test for choice between FE and RE for equation 5
Hausman Test
data: log x1it~ log x3it+ log t+0
chisq = 23.09, df = 2, p-value = 9.683e-06
alternative hypothesis: one model is inconsistent
Equation 6
- Test for choice between FE and POLS for equation 6
F test for individual effects
data: log x2it~ log x4it+ log x5it+log t + 0
F = 14833, df1 = 32, df2 = 93, p-value < 2.2e-16
alternative hypothesis: significant effects
- Test for choice between RE and POLS for equation 6
Lagrange Multiplier Test - (Breusch-Pagan)
data: log x2it~ log x4it+ log x5it+log t + 0
chisq = 186.73, df = 1, p-value < 2.2e-16
alternative hypothesis: significant effects
- Test for choice between FE and RE for equation 6
Hausman Test
data: log x2it~ log x4it+ log x5it+log t + 0
chisq = 1927.4, df = 3, p-value < 2.2e-16
alternative hypothesis: one model is inconsistent
DIAGNOSTICS FOR HETEROSCEDASTICITY, SERIAL CORRELATION AND CROSS-SECTIONAL DEPENDENCE
Equation 4
- Breusch-Pagan test for heteroscedasticity
BP = 1.3132, df = 1, p-value = 0.2518
- Wooldridge's test for serial correlation in FE panels
F = 8.0555, df1 = 1, df2 = 94, p-value = 0.005558
alternative hypothesis: serial correlation
- Pesaran CD test for cross-sectional dependence in panels
z = 7.1545, p-value = 8.401e-13
alternative hypothesis: cross-sectional dependence
Equation 5
- Breusch-Pagan test for heteroscedasticity
BP = 0.24624, df = 1, p-value =0.6197
- Wooldridge's test for serial correlation in FE panels
F = 0.36018, df1 = 1, df2 = 94, p-value = 0.5498
alternative hypothesis: serial correlation
- Pesaran CD test for cross-sectional dependence in panels
z = 28.138, p-value < 2.2e-16
alternative hypothesis: cross-sectional dependence
Equation 6
- Breusch-Pagan test for heteroscedasticity
BP = 0.029998, df = 2, p-value = 0.9851
- Wooldridge's test for serial correlation in FE panels
F = 45.141, df1 = 1, df2 = 94, p-value = 1.394e-09
alternative hypothesis: serial correlation
- Pesaran CD test for cross-sectional dependence in panels
z = 3.1154, p-value = 0.001837
alternative hypothesis: cross-sectional dependence
DRISCOLL AND KRAAY (1998) ROBUST COVARIANCE MATRIX ESTIMATOR CORRECTING FOR SERIAL CORRELATION AND CROSS-SECTIONAL DEPENDENCE
Equation 4
t test of coefficients using Driscoll and Kraay (1998) Robust Covariance Matrix Estimator:
| Variable |
Estimate |
Std. Error |
t value |
P-value (Probability >|t|) |
| log x1it |
2.042939 |
0.104399 |
19.569 |
< 2.2e-16 *** |
| log t |
0.965622 |
0.048048 |
20.097 |
< 2.2e-16 *** |
Equation 5
t test of coefficients using Driscoll and Kraay (1998) Robust Covariance Matrix Estimator:
| Variable |
Estimate |
Std. Error |
t value |
P-value (Probability >|t|) |
| log x3it |
0.974791 |
0.010384 |
93.875 |
< 2.2e-16 *** |
Equation 6
t test of coefficients using Driscoll and Kraay (1998) Robust Covariance Matrix Estimator:
| Variable |
Estimate |
Std. Error |
t value |
P-value (Probability >|t|) |
| log x4it |
-2.2985167 |
0.5258528 |
-4.3710 |
3.218e-05 *** |
| log x5it |
2.2539317 |
0.4487291 |
5.0229 |
2.450e-06 *** |
| log t |
0.2151629 |
0.0047093 |
45.6887 |
< 2.2e-16 *** |
STATIONARITY TESTS
Tests of stationarity, specifically panel unit root tests, have been conducted to check for stationarity of residuals of equations 4,5 and 6.
| Equation |
Choi's Inverse Normal Unit-Root Test statistic |
Choi's Inverse Normal Unit-Root Test statistic accounting for cross-sectional dependence |
P-value (Alternative hypothesis: stationarity) |
| 4 |
-11.515 |
-2.004504 |
0.02250805 |
| 5 |
-13.674 |
-2.380338 |
0.008648382 |
| 6 |
-13.021 |
-2.266665 |
0.01170535 |
The tests indicate stationarity of residuals implying validity of inference in case of non-stationary dependent and predictor variables. Non-stationarity of dependent variables in equations 4, 5 and 6 rules out the possibility of cointegration. The inclusion of log t has helped in accounting for non-stationarity as well.
RESULTS OF POOLED OLS FOR SCENARIO ANALYSIS:
Equation 5:
 Equation 6:
| STATE |
FOR THE FIVE TRILLION-DOLLAR ECONOMY (RUPEES IN CRORES) |
|
|
| VALUE OF DIGITAL TRANSACTIONS (RUPEES IN LAKH CRORES) |
VALUE OF DIGITAL TRANSACTIONS AS A SHARE OF TOTAL DIIGTALTRANSACTIONS (IN PERCENT) |
VALUE OF DIGITAL TRANSAACTIONS AS A SHARE OF NOMINAL GDP ( IN PERCENT) |
CHANGE IN THE VALUE OF DIGITAL TRANSACTIONS (IN PERCENT) |
|
|
|
|
| 2021-22 |
2025-26 |
2026-27 |
2028-29 |
2021-22 |
2025-26 |
2026-27 |
2028-29 |
2021-22 |
2025-26 |
2026-27 |
2028-29 |
2025-26 |
2026-27 |
2028-29 |
|
|
| ANDAMAN AND NICOBAR ISLANDS (*) |
0.0127 |
0.0243 |
0.0281 |
0.0357 |
0.015 |
0.01 |
0.01 |
0.01 |
0.005 |
0.006 |
0.006 |
0.008 |
91.5 |
121 |
181 |
|
|
| ANDHRA P |
8.68 |
24.0901 |
27.8311 |
35.3918 |
10.4 |
9.925 |
9.929 |
9.933 |
3.67 |
5.651 |
6.339 |
7.619 |
178 |
221 |
308 |
|
|
| ARUNACHAL P |
0.0505 |
0.1425 |
0.1642 |
0.2087 |
0.06 |
0.059 |
0.059 |
0.059 |
0.021 |
0.033 |
0.037 |
0.045 |
182 |
225 |
313 |
|
|
| ASSAM |
0.752 |
1.9506 |
2.255 |
2.8691 |
0.897 |
0.804 |
0.805 |
0.805 |
0.318 |
0.458 |
0.514 |
0.618 |
159 |
200 |
282 |
|
|
| BIHAR |
3.85 |
10.8521 |
12.5103 |
15.8928 |
4.59 |
4.471 |
4.463 |
4.461 |
1.63 |
2.546 |
2.85 |
3.421 |
182 |
225 |
313 |
|
|
| CHANDIGARH |
0.101 |
0.4094 |
0.472 |
0.6 |
0.12 |
0.169 |
0.168 |
0.168 |
0.043 |
0.096 |
0.108 |
0.129 |
305 |
367 |
494 |
|
|
| CHATTISGARH |
0.967 |
2.8983 |
3.3445 |
4.2514 |
1.15 |
1.194 |
1.193 |
1.193 |
0.409 |
0.68 |
0.762 |
0.915 |
200 |
246 |
340 |
|
|
| DELHI |
3.43 |
11.9681 |
13.8077 |
17.5295 |
4.09 |
4.931 |
4.926 |
4.92 |
1.45 |
2.808 |
3.145 |
3.774 |
249 |
303 |
411 |
|
|
| GOA |
0.115 |
0.3198 |
0.369 |
0.4699 |
0.137 |
0.132 |
0.132 |
0.132 |
0.049 |
0.075 |
0.084 |
0.101 |
178 |
221 |
309 |
|
|
| GUJARAT |
2.47 |
7.6287 |
8.8324 |
11.237 |
2.95 |
3.143 |
3.151 |
3.154 |
1.04 |
1.79 |
2.012 |
2.419 |
209 |
258 |
355 |
|
|
| HARYANA |
2.21 |
6.0093 |
6.9367 |
8.8301 |
2.64 |
2.476 |
2.475 |
2.478 |
0.934 |
1.41 |
1.58 |
1.901 |
172 |
214 |
300 |
|
|
| HIMACHAL PRADESH |
0.183 |
0.6798 |
0.7855 |
1.0019 |
0.218 |
0.28 |
0.28 |
0.281 |
0.077 |
0.159 |
0.179 |
0.216 |
271 |
329 |
447 |
|
|
| JHARKAND |
1.19 |
3.3992 |
3.9284 |
4.995 |
1.42 |
1.4 |
1.402 |
1.402 |
0.503 |
0.797 |
0.895 |
1.075 |
186 |
230 |
320 |
|
|
| KARNATAKA |
9.95 |
29.8675 |
34.5261 |
43.7638 |
11.9 |
12.305 |
12.318 |
12.283 |
4.2 |
7.007 |
7.864 |
9.422 |
200 |
247 |
340 |
|
|
| KERALA |
0.89 |
2.5121 |
2.9018 |
3.6893 |
1.06 |
1.035 |
1.035 |
1.035 |
0.376 |
0.589 |
0.661 |
0.794 |
182 |
226 |
315 |
|
|
| MADHYA PRADESH |
4.73 |
12.8517 |
14.8451 |
18.8663 |
5.64 |
5.295 |
5.296 |
5.295 |
2 |
3.015 |
3.381 |
4.062 |
172 |
214 |
299 |
|
|
| MAHARASHTRA |
10.6 |
29.1488 |
33.6437 |
42.8623 |
12.6 |
12.009 |
12.003 |
12.03 |
4.48 |
6.838 |
7.663 |
9.227 |
175 |
217 |
304 |
|
|
| MANIPUR |
0.0914 |
0.2106 |
0.2433 |
0.3093 |
0.109 |
0.087 |
0.087 |
0.087 |
0.039 |
0.049 |
0.055 |
0.067 |
130 |
166 |
238 |
|
|
| MEGHALAYA |
0.0273 |
0.0863 |
0.0998 |
0.1268 |
0.033 |
0.036 |
0.036 |
0.036 |
0.012 |
0.02 |
0.023 |
0.027 |
216 |
266 |
365 |
|
|
| MIZORAM |
0.0128 |
0.044 |
0.0508 |
0.0646 |
0.015 |
0.018 |
0.018 |
0.018 |
0.005 |
0.01 |
0.012 |
0.014 |
244 |
297 |
404 |
|
|
| NAGALAND |
0.0357 |
0.1045 |
0.1208 |
0.1532 |
0.043 |
0.043 |
0.043 |
0.043 |
0.015 |
0.025 |
0.028 |
0.033 |
193 |
238 |
329 |
|
|
| ODISHA |
2.81 |
8.5358 |
9.8517 |
12.5236 |
3.35 |
3.517 |
3.515 |
3.515 |
1.19 |
2.002 |
2.244 |
2.696 |
204 |
251 |
346 |
|
|
| PUDUCHERRY |
0.0764 |
0.2161 |
0.2499 |
0.318 |
0.091 |
0.089 |
0.089 |
0.089 |
0.032 |
0.051 |
0.057 |
0.068 |
183 |
227 |
316 |
|
|
| PUNJAB |
0.779 |
2.7898 |
3.2189 |
4.0962 |
0.929 |
1.149 |
1.148 |
1.15 |
0.329 |
0.654 |
0.733 |
0.882 |
258 |
313 |
426 |
|
|
| RAJASTHAN |
6.48 |
17.1926 |
19.8555 |
25.2652 |
7.73 |
7.083 |
7.084 |
7.091 |
2.74 |
4.033 |
4.523 |
5.439 |
165 |
206 |
290 |
|
|
| SIKKIM |
0.0283 |
0.0992 |
0.1144 |
0.1457 |
0.034 |
0.041 |
0.041 |
0.041 |
0.012 |
0.023 |
0.026 |
0.031 |
250 |
304 |
415 |
|
|
| TAMIL NADU |
3.21 |
10.9042 |
12.6265 |
16.0684 |
3.83 |
4.492 |
4.505 |
4.51 |
1.36 |
2.558 |
2.876 |
3.459 |
240 |
293 |
401 |
|
|
| TELANGANA |
10.8 |
28.7635 |
33.1928 |
42.1827 |
12.9 |
11.85 |
11.842 |
11.839 |
4.56 |
6.748 |
7.561 |
9.081 |
166 |
207 |
291 |
|
|
| TRIPURA |
0.0397 |
0.1442 |
0.1667 |
0.2119 |
0.047 |
0.059 |
0.06 |
0.06 |
0.017 |
0.034 |
0.038 |
0.046 |
263 |
320 |
434 |
|
|
| UTTAR PRADESH |
5.46 |
16.8982 |
19.479 |
24.7312 |
6.51 |
6.962 |
6.95 |
6.941 |
2.31 |
3.964 |
4.437 |
5.324 |
209 |
257 |
353 |
|
|
| UTTARAKHAND |
0.463 |
1.5072 |
1.7378 |
2.2097 |
0.552 |
0.621 |
0.62 |
0.62 |
0.196 |
0.354 |
0.396 |
0.476 |
226 |
275 |
377 |
|
|
| WEST BENGAL |
3.35 |
10.4851 |
12.1054 |
15.3992 |
4 |
4.32 |
4.319 |
4.322 |
1.42 |
2.46 |
2.757 |
3.315 |
213 |
261 |
360 |
|
|
TABLE: RESULTS OF SCENARIO ANALYSIS FOR A FIVE TRILLION-DOLLAR ECONOMY
| FOR POSSIBLE GROWTH SCENARIOS FOR THE YEAR 2030-31 |
| STATE |
VALUE OF DIGITAL TRANSACTIONS (RUPEES IN LAKH CRORES) |
VALUE OF DIGITAL TRANSACTIONS AS A SHARE OF TOTAL DIGITAL TRANSACTIONS (IN PERCENT) |
VALUE OF DIGITAL TRANSACTIONS AS A SHARE OF NOMINAL GDP |
CHANGE IN THE VALUE OF DIGITAL TRANSACTIONS (IN PERCENT) |
| 2021-22 |
6.3 PERCENT GROWTH |
5 PERCENT GROWTH |
2021-22 |
6.3 PERCENT GROWTH |
5 PERCENT GROWTH |
2021-22 |
6.3 PERCENT GROWTH |
5 PERCENT GROWTH |
6.3 PERCENT GROWTH |
5 PERCENT GROWTH |
| ANDAMAN AND NICOBAR ISLANDS (*) |
0.0127 |
0.058402 |
0.053387 |
0.015 |
0.01 |
0.01 |
0.005 |
0.0083 |
0.0085 |
360 |
320 |
| ANDHRA P |
8.68 |
59.9194 |
54.1984 |
10.4 |
9.975 |
9.987 |
3.67 |
8.5241 |
8.6132 |
590 |
411 |
| ARUNACHAL P |
0.0505 |
0.346339 |
0.314699 |
0.06 |
0.058 |
0.058 |
0.021 |
0.0493 |
0.05 |
586 |
477 |
| ASSAM |
0.752 |
4.78007 |
4.33723 |
0.897 |
0.796 |
0.799 |
0.318 |
0.68 |
0.6893 |
536 |
495 |
| BIHAR |
3.85 |
26.8956 |
24.2655 |
4.59 |
4.478 |
4.471 |
1.63 |
3.8262 |
3.8563 |
599 |
499 |
| CHANDIGARH |
0.101 |
1.00298 |
0.908191 |
0.12 |
0.167 |
0.167 |
0.043 |
0.1427 |
0.1443 |
893 |
507 |
| CHATTISGARH |
0.967 |
7.12521 |
6.45269 |
1.15 |
1.186 |
1.189 |
0.409 |
1.0136 |
1.0255 |
637 |
509 |
| DELHI |
3.43 |
29.5665 |
26.7147 |
4.09 |
4.922 |
4.923 |
1.45 |
4.2061 |
4.2455 |
762 |
514 |
| GOA |
0.115 |
0.777452 |
0.706538 |
0.137 |
0.129 |
0.13 |
0.049 |
0.1106 |
0.1123 |
576 |
514 |
| GUJARAT |
2.47 |
18.664 |
16.9361 |
2.95 |
3.107 |
3.121 |
1.04 |
2.6551 |
2.6915 |
656 |
523 |
| HARYANA |
2.21 |
14.8064 |
13.4075 |
2.64 |
2.465 |
2.471 |
0.934 |
2.1064 |
2.1307 |
570 |
524 |
| HIMACHAL PRADESH |
0.183 |
1.66153 |
1.50665 |
0.218 |
0.277 |
0.278 |
0.077 |
0.2364 |
0.2394 |
808 |
525 |
| JHARKAND |
1.19 |
8.36183 |
7.56668 |
1.42 |
1.392 |
1.394 |
0.503 |
1.1896 |
1.2025 |
603 |
527 |
| KARNATAKA |
9.95 |
73.9781 |
66.8109 |
11.9 |
12.316 |
12.311 |
4.2 |
10.5241 |
10.6176 |
643 |
530 |
| KERALA |
0.89 |
6.11989 |
5.56221 |
1.06 |
1.019 |
1.025 |
0.376 |
0.8706 |
0.8839 |
588 |
536 |
| MADHYA PRADESH |
4.73 |
31.8841 |
28.7861 |
5.64 |
5.308 |
5.304 |
2 |
4.5358 |
4.5747 |
574 |
547 |
| MAHARASHTRA |
10.6 |
71.9891 |
65.0699 |
12.6 |
11.985 |
11.991 |
4.48 |
10.2412 |
10.3409 |
579 |
567 |
| MANIPUR |
0.0914 |
0.51452 |
0.467182 |
0.109 |
0.086 |
0.086 |
0.039 |
0.0732 |
0.0742 |
463 |
571 |
| MEGHALAYA |
0.0273 |
0.20813 |
0.189832 |
0.033 |
0.035 |
0.035 |
0.012 |
0.0296 |
0.0302 |
662 |
580 |
| MIZORAM |
0.0128 |
0.105841 |
0.096586 |
0.015 |
0.018 |
0.018 |
0.005 |
0.0151 |
0.0153 |
727 |
586 |
| NAGALAND |
0.0357 |
0.253365 |
0.230826 |
0.043 |
0.042 |
0.043 |
0.015 |
0.036 |
0.0367 |
610 |
587 |
| ODISHA |
2.81 |
21.137 |
19.0968 |
3.35 |
3.519 |
3.519 |
1.19 |
3.0069 |
3.0349 |
652 |
595 |
| PUDUCHERRY |
0.0764 |
0.527993 |
0.479402 |
0.091 |
0.088 |
0.088 |
0.032 |
0.0751 |
0.0762 |
591 |
597 |
| PUNJAB |
0.779 |
6.8105 |
6.18436 |
0.929 |
1.134 |
1.14 |
0.329 |
0.9689 |
0.9828 |
774 |
622 |
| RAJASTHAN |
6.48 |
42.7541 |
38.5657 |
7.73 |
7.118 |
7.107 |
2.74 |
6.0822 |
6.1289 |
560 |
655 |
| SIKKIM |
0.0283 |
0.241338 |
0.219064 |
0.034 |
0.04 |
0.04 |
0.012 |
0.0343 |
0.0348 |
753 |
658 |
| TAMIL NADU |
3.21 |
26.8213 |
24.3467 |
3.83 |
4.465 |
4.486 |
1.36 |
3.8156 |
3.8692 |
736 |
674 |
| TELANGANA |
10.8 |
71.8277 |
64.6694 |
12.9 |
11.958 |
11.917 |
4.56 |
10.2182 |
10.2773 |
565 |
679 |
| TRIPURA |
0.0397 |
0.349275 |
0.317883 |
0.047 |
0.058 |
0.059 |
0.017 |
0.0497 |
0.0505 |
780 |
694 |
| UTTAR PRADESH |
5.46 |
41.6311 |
37.508 |
6.51 |
6.931 |
6.912 |
2.31 |
5.9224 |
5.9608 |
662 |
701 |
| UTTARAKHAND |
0.463 |
3.68421 |
3.34312 |
0.552 |
0.613 |
0.616 |
0.196 |
0.5241 |
0.5313 |
696 |
723 |
| WEST BENGAL |
3.35 |
25.8636 |
23.3639 |
4 |
4.306 |
4.305 |
1.42 |
3.6794 |
3.713 |
672 |
799 |
TABLE: RESULTS FOR SCENARIO ANALYSIS FOR THE POSSIBLE GROWTH SCENARIOS IN THE YEAR 2030-31
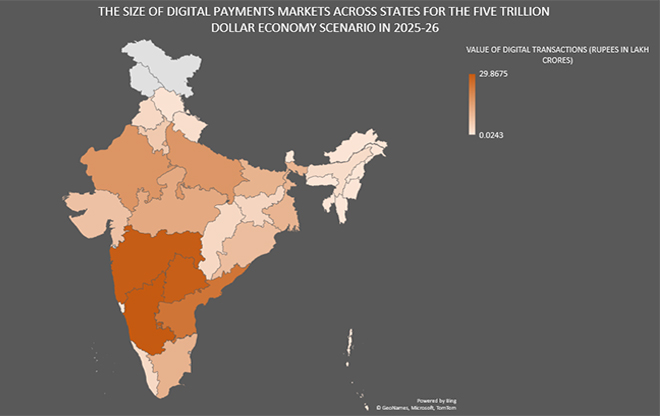
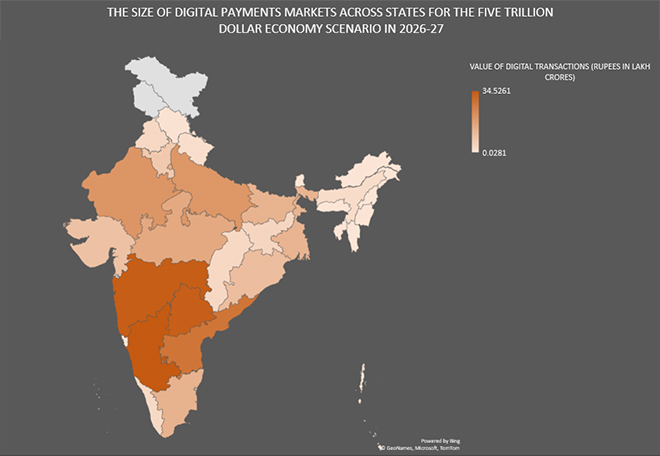
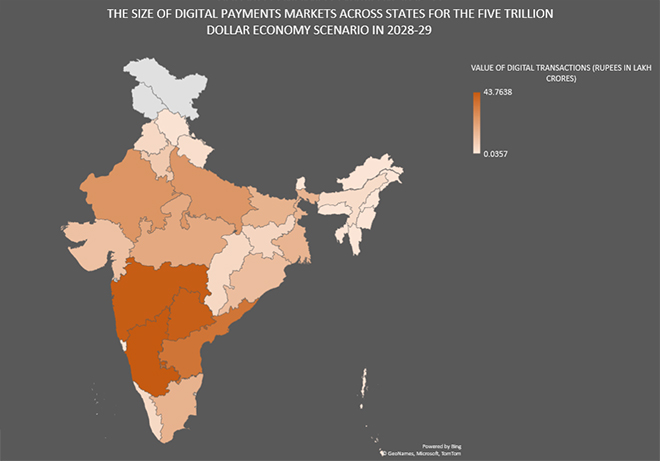
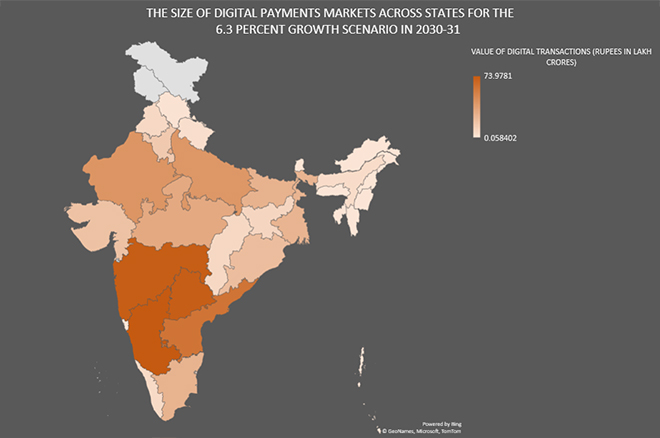
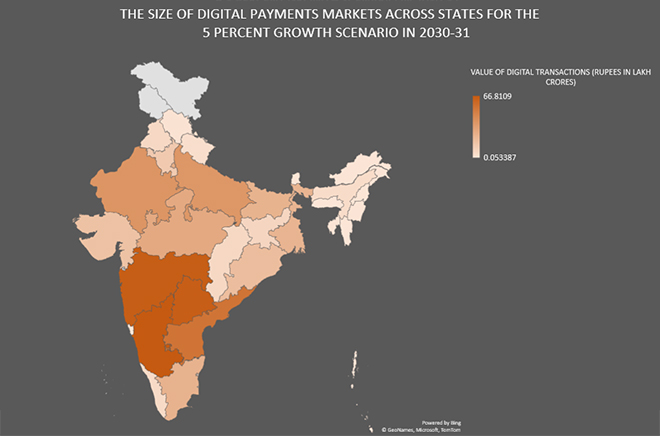
Endnotes
[a] Digital transactions in India have witnessed phenomenal growth and not just in terms of Bharat Interface for Money-Unified Payments Interface (BHIM-UPI). Other modes of digital payments used extensively in India include Immediate Payment Service (IMPS); pre-paid payment instruments (PPIs) and National Electronic Toll Collection (NETC) system, debit cards, credit cards, National Electronic Funds Transfer (NEFT) and Real-Time Gross Settlement (RTGS).
[b] Such parameters include cyber-security, data privacy, booming of e-commerce and affordability of devices such as smartphones.
[c] This below average mark represents a scenario that is below all possible CAGR projections for India till 2030. Given that Goldman Sachs, Price Waterhouse Coopers, and OECD project CAGR of 8.9%, 7.9% and 6.6% respectively between 2022 and 2030, a “pessimistic” growth scenario may be that of 5% CAGR. The authors perceive that the CAGR till 2030 cannot go below 5%.
[d] The Committee on Payments and Market Infrastructures (CPMI) is an international organisation that seeks to ensure financial and economic stability via standard-setting that encourages, supervises, and makes recommendations supporting safety and efficiency of payment, clearing, settlement and related arrangements.
[e] The Cobb-Douglas production function is a standard form of capturing the influence of inputs on the production of an output. In its log-linear form, it enables to determine the relative contribution of inputs to the growth of an output.
[1]Amritkumar Dudhat and Vertika Agarwal, “Indonesia's Digital Economy's Development”, IAIC Transactions on Sustainable Digital Innovation (ITSDI), 4(2), (2023):109-118 , https://doi.org/10.34306/itsdi.v4i2.580
[2] Kevin Barefoot et al., “Defining and Measuring the Digital Economy”, Bureau of Economic Analysis, US Department of Commerce, Working Paper (2018), https://www.bea.gov/sites/default/files/papers/defining-and-measuring-the-digital-economy.pdf
[3] PWC, “Emerging Markets: Driving the payments transformation”, PWC, https://www.pwc.com/gx/en/industries/financial-services/publications/emerging-markets-driving-payments.html
[4] Hoda Mansour, "How successful countries are in promoting digital transactions during COVID-19", Journal of Economic Studies, 49 (3), (2022): 435-452, https://doi.org/10.1108/JES-10-2020-0489
[5] Douglas Blakey, “India: shift from cash to electronic payments gathers pace”, Electronic Payments International, February 28, 2023, www.electronicpaymentsinternational.com
[6] “India leads the world in real-time digital payments, says PM Modi”, India News, August 15, 2022, https://www.business-standard.com/article/current-affairs/india-leads-the-world-in-real-time-digital-payments-says-pm-modi-122081500622_1.html
[7] Ministry of Electronics & IT, Government of India, https://pib.gov.in/PressReleaseIframePage.aspx?PRID=1897272
[8] “India's digital payments market will more than triple to $10 trillion by 2026: Report”, The Economic Times, March 9, 2023, https://economictimes.indiatimes.com/news/economy/finance/indias-digital-payments-market-will-more-than-triple-to-10-trillion-by-2026-report/articleshow/98522718.cms
[9] Ministry of Electronics & IT, Government of India, https://pib.gov.in/PressReleaseIframePage.aspx?PRID=1897272
[10] Ministry of Finance, Government of India, https://pib.gov.in/FeaturesDeatils.aspx?NoteId=151163&ModuleId%20=%202
[11] “Economic Survey 2023: UPI accounted for 52% of India's total digital transactions in FY22”, Money control, January 31, 2023, https://www.moneycontrol.com/news/business/economic-survey-2023-upi-accounted-for-52-of-indias-total-digital-transactions-in-fy22-9970741.html
[12] “Economic Survey 2023: UPI accounted for 52% of total digital transactions in FY22”, Business Today, January 31, 2023, https://www.businesstoday.in/latest/economy/story/economic-survey-2023-upi-accounted-for-52-of-total-digital-transactions-in-fy22-368267-2023-01-31
[13] Adriana Nunez, “India strengthens payments ecosystem with UPI expansion”, Insider Intelligence, September 22, 2022, https://www.insiderintelligence.com/content/india-strengthens-payments-ecosystem-with-upi-expansion
[14] “Growth of Digital Payments in India: 5 Factors That are Driving it”, PayTm Business Blog, September 17, 2022, https://business.paytm.com/blog/growth-of-digital-payments-india/
[15] “India's digital payments market will more than triple to $10 trillion by 2026: Report”, The Economic Times, March 9, 2023, https://economictimes.indiatimes.com/news/economy/finance/indias-digital-payments-market-will-more-than-triple-to-10-trillion-by-2026-report/articleshow/98522718.cms
[16] Douglas Blakey, “India: shift from cash to electronic payments gathers pace”, Electronic Payments International, February 28, 2023, www.electronicpaymentsinternational.com
[17] Douglas Blakey, “India: shift from cash to electronic payments gathers pace”, Electronic Payments International, February 28, 2023, www.electronicpaymentsinternational.com
[18] “Growth of Digital Payments in India: 5 Factors That are Driving it”, PayTm Business Blog, September 17, 2022, https://business.paytm.com/blog/growth-of-digital-payments-india/
[19] Inder Pal Singh Sethi, “Digital Payments driving the growth of Digital Economy”, National Informatics Centre, https://www.nic.in/blogs/digital-payments-driving-the-growth-of-digital-economy/#:~:text=In%202018%2C%20the%20YoY%20growth,trillion%20processed%20in%20December%202020.
[20] Ministry of Finance, Government of India, https://pib.gov.in/FeaturesDeatils.aspx?NoteId=151163&ModuleId%20=%202
[21] “The beginning of digital payments in India”, Smart Money, https://smartmoney.angelone.in/chapter/the-beginning-of-digital-payments-in-India/
[22] Ministry of Finance, Government of India, https://pib.gov.in/FeaturesDeatils.aspx?NoteId=151163&ModuleId%20=%202
[23] “Reserve Bank of India introduces the RBI-Digital Payments Index”, Press Release, Reserve Bank of India, January 01, 2021, https://www.rbi.org.in/Scripts/BS_PressReleaseDisplay.aspx?prid=50901
[24] “RBI’s Digital Payments Index Jumps to 377.46 in Sept from 349.30 in March”, Adda 247 Current Affairs, February 2, 2023, https://currentaffairs.adda247.com/rbis-digital-payments-index-jumps-to-377-46-in-sept-from-349-30-in-march/
[25] “Reserve Bank of India announces Digital Payments Index for March 2022”, Press Release, Reserve Bank of India, July 27, 2022, https://rbidocs.rbi.org.in/rdocs/PressRelease/PDFs/PR602DPI147FB19811794BBB8CCBF29AF13B09CA.PDF
[26] Douglas Blakey, “India: shift from cash to electronic payments gathers pace”, Electronic Payments International, February 28, 2023, www.electronicpaymentsinternational.com
[27] National Payments Corporation of India, UPI Product Statistics, https://www.npci.org.in/what-we-do/upi/product-statistics
[28] PhonePe Pulse and Boston Consulting Group, “Digital Payments in India: A US$10 Trillion Opportunity”, https://www.phonepe.com/pulse-static-api/v1/static/docs/PhonePe_Pulse_BCG_report.pdf
[30] “India may become $5 trillion economy by 2025-26, says CEA Nageswaran”, The Print, February 1, 2022, https://theprint.in/ani-press-releases/india-may-become-5-trillion-economy-by-2025-26-says-cea-nageswaran/818791/
[31] Saurabh Sharma, “77th Independence Day: Here's when India is likely to become world's 3rd largest economy”, Business Today, August 14, 2023, https://www.businesstoday.in/latest/story/77th-independence-day-heres-when-india-is-likely-to-become-worlds-3rd-largest-economy-394149-2023-08-14
[32] Price Waterhouse Coopers, “Emerging Markets Driving the payments transformation”, PwC , https://www.pwc.com/gx/en/financial-services/publications/assets/pwc-emerging-markets-12-July.pdf
[33] McKinsey Global Institute, “ DIGITAL FINANCE FOR ALL: POWERING INCLUSIVE GROWTH IN EMERGING ECONOMIES”, McKinsey & Company, September 2016, https://www.mckinsey.com/~/media/mckinsey/featured%20insights/Employment%20and%20Growth/How%20digital%20finance%20could%20boost%20growth%20in%20emerging%20economies/MGI-Digital-Finance-For-All-Executive-summary-September-2016.ashx
[34] NK Singh et al., “Critical success factors of the digital payment infrastructure for developing economies”, in Proceedings of the Smart Working, Living and Organising: IFIP WG 8.6 International Conference on Transfer and Diffusion of IT. 25 Jun 2018. Portsmouth, UK., ed. Elbanna A, Dwivedi YK, Bunker D et al , IFIP Advances in Information and Communication Technology, vol 533, Cham: Springer, (2019):113-125, https://bradscholars.brad.ac.uk/bitstream/handle/10454/18086/30-48016.pdf;jsessionid=D232C275D9F57936B0D53447239747E5?sequence=2
[35] Ayushi Rastogi and Madhavi Damle, “TRENDS IN THE GROWTH PATTERN OF DIGITAL PAYMENT MODES IN INDIA AFTER DEMONITIZATION”, PalArch’s Journal of Archaeology of Egypt / Egyptology, 17(6), (2020):4896 – 4927, https://archives.palarch.nl/index.php/jae/article/view/1732
[36] Sudiksha Shree et al., “Digital payments and consumer experience in India: a survey based empirical study”, Journal of Banking and Financial Technology 5, (2021):1–20, https://doi.org/10.1007/s42786-020-00024-z
[37] Sunil Mani and Chidambaran G. Iyer, “Diffusion of digital payments in India, 2011–2012 through 2020–2021: role of its sectoral system of innovation”, Asian Journal of Technology Innovation, (2022)
[38] Vandana Bhavsar and Pradeepta Kumar Samanta, “Sustainability of Digital Payments: Empirical Evidence from India”, Proceedings of the 2nd International Conference on Sustainability and Equity (ICSE-2021).
Atlantis Highlights in Social Sciences, Education and Humanities, (2022), https://www.atlantis-press.com/proceedings/icse-21/125968843
[39] Marc Glowka, Anneke Kosse and Robert Szemere, “Digital payments make gains but cash remains”, CPMI Brief No 1., January 2023, https://www.bis.org/statistics/payment_stats/commentary2301.htm#:~:text=The%20volume%20and%20value%20of,and%20as%20a%20safe%20haven.
[40] PhonePe Pulse and Boston Consulting Group, “Digital Payments in India: A US$10 Trillion Opportunity”, https://www.phonepe.com/pulse-static-api/v1/static/docs/PhonePe_Pulse_BCG_report.pdf
[41] “RBI Digital Payments Index Surges 13.24% YoY As Online Transactions Jump 50%”, Outlook Money, July 28, 2023, https://www.outlookindia.com/business/rbi-digital-payments-index-surges-13-24-yoy-as-online-transactions-jump-50--news-306339
[42] Mark Zandi et al., “The Impact of Electronic Payments on Economic Growth”, Moody’s Analytics, (2016), https://usa.visa.com/content/dam/VCOM/download/visa-everywhere/global-impact/impact-of-electronic-payments-on-economic-growth.pdf
[43] Hock-Han Tee and Hway-Boon Ong, “Cashless payment and economic growth”, Financial Innovation, 2(4): (2016), https://doi.org/10.1186/s40854-016-0023-z
[44] Teck-Lee Wong, Wee-Yeap Lau and Tien-Ming Yip, “Cashless payments and economic growth: Evidence from selected OECD countries”, Journal of Central Banking Theory and Practice, (2020):189-213
[45] T. Ravikumar et al., “Impact of Digital Payments on Economic Growth: Evidence from India”, International Journal of Innovative Technology and Exploring Engineering 8(12), October 2019, https://www.ijitee.org/wp-content/uploads/papers/v8i12/L34321081219.pdf
[46] Nenavath Sreenu. “Cashless Payment Policy and Its Effects on Economic Growth of India: An Exploratory Study”, ACM Transactions on Management Information Systems, 11(3), (2020):1–10, https://doi.org/10.1145/3391402
[47] Yi-Xun Pang, Sin-Huei Ng, and Wei-Theng Lau. “Digital Cashless Payments and Economic Growth: Evidence from CPMI Countries”, Capital Markets Review Vol. 30, No. 2, (2022): 63-89. https://www.mfa.com.my/wp-content/uploads/2022/10/v30_i2_a4_pg63-89.pdf
[48] Will Kenton, “Consumption Function: Formula, Assumptions, and Implications”, Investopedia, June 27, 2023, https://www.investopedia.com/terms/c/consumptionfunction.asp
[49] Tufts University, “Digital Intelligence Index”, Digital Planet, https://digitalintelligence.fletcher.tufts.edu/trajectory
[50] Tufts University, “Digital Intelligence Index”
[51] Tufts University, “Digital Intelligence Index”
[52] PhonePe Pulse, “The Beat of Progress”, https://www.phonepe.com/pulse/explore/transaction/2022/4/uttar pradesh/
[53] “Net State Domestic Product - State-wise (At Constant Prices)”, Handbook of Statistics on the Indian Economy, 2022-23, Reserve Bank of India, https://www.rbi.org.in/Scripts/AnnualPublications.aspx?head=Handbook%20of%20Statistics%20on%20Indian%20Economy
[54]“ Basic Statistical Return (BSR)2 – Deposits with Scheduled Commercial Banks (SCBs)”, Annual Publications, Reserve Bank of India, https://www.rbi.org.in/Scripts/AnnualPublications.aspx?head=Basic%20Statistical%20Return%20BSR%202%20-%20Deposits%20with%20Scheduled%20Commercial%20Banks%20SCBs
[55] Global Data Lab, Subnational HDI, https://globaldatalab.org/shdi/table/2021/esch+msch+lgnicf+lgnicm/?levels=1+4&interpolation=0&extrapolation=0
[56] Alexander J.A.M. Van Deursen and Jan A.G.M. van Dijk, “Improving digital skills for the use of online public information and services”, Government Information Quarterly 26 (2009): 333–340, https://ris.utwente.nl/ws/files/6812950/Deursen09improving.pdf
[57]Alexander J.A.M. van Deursen, Jan A.G.M. van Dijk and Oscar Peters, “Rethinking Internet skills: The contribution of gender, age, education, Internet experience, and hours online to medium- and content-related Internet skills”, Poetics, Volume 39, Issue 2, (2011):125-144 , https://www.sciencedirect.com/science/article/abs/pii/S0304422X11000106
[58] Performance Indicators Reports, Telecom Regulatory Authority of India, https://www.trai.gov.in/release-publication/reports/performance-indicators-reports
[59] Global Data Lab, Subnational HDI, https://globaldatalab.org/shdi/table/2021/esch+msch+lgnicf+lgnicm/?levels=1+4&interpolation=0&extrapolation=0
[60] Christina Sanchita Shah and Satish Krishnan, “ICT, Gender Inequality, and Income Inequality: A Panel Data Analysis Across Countries”, Information Systems Frontiers (2023), https://link.springer.com/article/10.1007/s10796-023-10396-4#:~:text=Our%20study%20shows%20a%20negative,income%20inequality%20in%20a%20country.
[61] Amy Antonio and David Tuffley, “The Gender Digital Divide in Developing Countries”, Future Internet 6(4), (2014):673-687, https://doi.org/10.3390/fi6040673
[62]“India may become $5 trillion economy by 2025-26, says CEA Nageswaran”, The Print, February 1, 2022, https://theprint.in/ani-press-releases/india-may-become-5-trillion-economy-by-2025-26-says-cea-nageswaran/818791/
[63] “Govt taking steps to make India $5 trillion economy 'at an early date': Finance ministry”, The Times of India, March 14, 2023, https://timesofindia.indiatimes.com/business/india-business/govt-taking-steps-to-make-india-5-trillion-economy-at-an-early-date-finance-ministry/articleshow/98633527.cms?from=mdr
[64] “India may become a $5 trillion economy by FY29 if GDP grows at 9% for 5 years”, Live Mint, August 15, 2022, https://www.livemint.com/news/india/india-may-become-a-5-trillion-economy-by-fy29-if-gdp-grows-at-9-for-5-years-11660577016106.html
[65] Handbook of Statistics on Indian States 2021-22, Reserve Bank of India, https://www.rbi.org.in/Scripts/AnnualPublications.aspx?head=Handbook%20of%20Statistics%20on%20Indian%20States
[66] Index Mundi, “India – GDP Deflator”, https://www.indexmundi.com/facts/india/gdp-deflator
[67] OFX, Historical Exchange Rates, https://www.ofx.com/en-au/forex-news/historical-exchange-rates/yearly-average-rates/
[68]Handbook of Statistics on Indian States 2021-22, Reserve Bank of India
[69] Index Mundi, “India – GDP Deflator”, https://www.indexmundi.com/facts/india/gdp-deflator
[70] OFX, Historical Exchange Rates, https://www.ofx.com/en-au/forex-news/historical-exchange-rates/yearly-average-rates/
[71] Pradhan Mantri Jan Dhan Yojana (PMJDY), Department of Financial Services, Ministry of Finance, Government of India, https://pmjdy.gov.in/
[72] Vaishnavi Chandrasekhar, “Understanding the digital divide in financial inclusion”, Observer Research Foundation, November 15, 2022,
https://www.orfonline.org/expert-speak/understanding-the-digital-divide-in-financial-inclusion/
[73] Vaishnavi Chandrasekhar, “Understanding the digital divide in financial inclusion”, Observer Research Foundation, November 15, 2022,
https://www.orfonline.org/expert-speak/understanding-the-digital-divide-in-financial-inclusion/
[74] Vaishnavi Chandrasekhar, “Understanding the digital divide in financial inclusion”, Observer Research Foundation, November 15, 2022,
https://www.orfonline.org/expert-speak/understanding-the-digital-divide-in-financial-inclusion/
[75] “Bridging the Digital Gender Divide: Include, Upskill, Innovate”, OECD, 2018, https://www.oecd.org/digital/bridging-the-digital-gender-divide.pdf
[76] Kate Lauer and Timothy Lyman, “Digital Financial Inclusion: Implications for Customers, Regulators, Supervisors, and Standard-Setting Bodies”, CGAP, 2015 March, https://www.worldbank.org/en/topic/financialinclusion/publication/digital-financial-inclusion
[77] Sumeysh Srivastava, “Improving digital literacy in India – a review”, International Telecommunications Union, December 16, 2022,
https://www.itu.int/hub/2022/12/improving-digital-literacy-in-india-a-review/
[78] K Srinivasa Rao, “Improving digital literacy in India – a review”, The Hindu Business Line, January 2, 2020,
https://www.thehindubusinessline.com/opinion/digital-literacy-is-integral-for-financial-inclusion/article30432071.ece
[79] Venugopal Mothkoor and Fatima Mumtaz, “The digital dream: Upskilling India for the future”, Ideas for India, March 23, 2021, https://www.ideasforindia.in/topics/governance/the-digital-dream-upskilling-india-for-the-future.html
The views expressed above belong to the author(s). ORF research and analyses now available on Telegram! Click here to access our curated content — blogs, longforms and interviews.

 PDF Download